


 08:45
08:45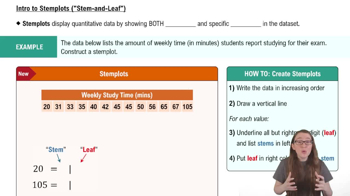


Textbook Question
Graphing Data Sets In Exercises 17–32, organize the data using the indicated type of graph. Describe any patterns.
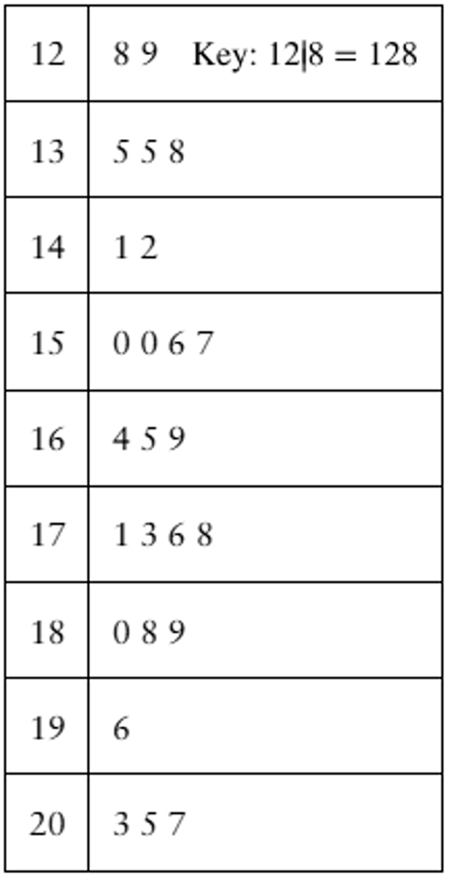
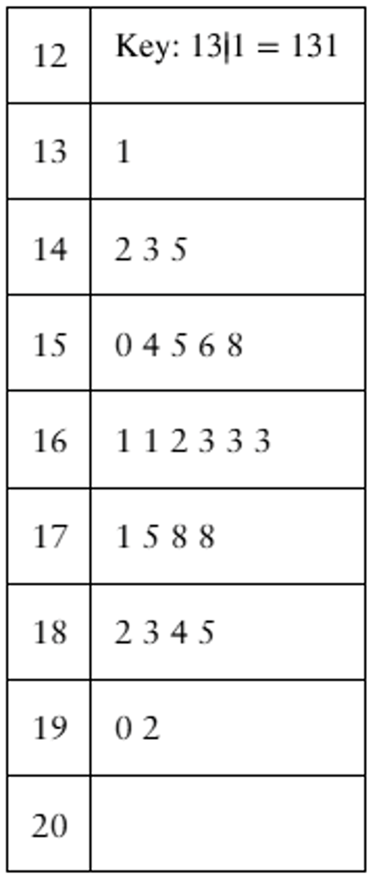
Highest-Paid Athletes Use a stem-and-leaf plot that has two rows for each stem to display the data, which represent the incomes (in millions) of the top 30 highest-paid athletes. (Source: Forbes Media LLC)
39 42 41 45 48 48 106 45 88 54 61 37 62 74 40
47 56 57 105 96 37 48 41 64 52 47 45 59 49 104