HIC Measurements Listed below are head injury criterion (HIC) measurements from crash tests of small, midsize, large, and SUV vehicles. In using the Kruskal-Wallis test, we must rank all of the data combined, and then we must find the sum of the ranks for each sample. Find the sum of the ranks for each of the four samples.
Table of contents
- 1. Intro to Stats and Collecting Data1h 14m
- 2. Describing Data with Tables and Graphs1h 56m
- 3. Describing Data Numerically2h 5m
- 4. Probability2h 16m
- 5. Binomial Distribution & Discrete Random Variables3h 6m
- 6. Normal Distribution and Continuous Random Variables2h 11m
- 7. Sampling Distributions & Confidence Intervals: Mean3h 23m
- Sampling Distribution of the Sample Mean and Central Limit Theorem19m
- Distribution of Sample Mean - Excel23m
- Introduction to Confidence Intervals15m
- Confidence Intervals for Population Mean1h 18m
- Determining the Minimum Sample Size Required12m
- Finding Probabilities and T Critical Values - Excel28m
- Confidence Intervals for Population Means - Excel25m
- 8. Sampling Distributions & Confidence Intervals: Proportion2h 10m
- 9. Hypothesis Testing for One Sample5h 8m
- Steps in Hypothesis Testing1h 6m
- Performing Hypothesis Tests: Means1h 4m
- Hypothesis Testing: Means - Excel42m
- Performing Hypothesis Tests: Proportions37m
- Hypothesis Testing: Proportions - Excel27m
- Performing Hypothesis Tests: Variance12m
- Critical Values and Rejection Regions28m
- Link Between Confidence Intervals and Hypothesis Testing12m
- Type I & Type II Errors16m
- 10. Hypothesis Testing for Two Samples5h 37m
- Two Proportions1h 13m
- Two Proportions Hypothesis Test - Excel28m
- Two Means - Unknown, Unequal Variance1h 3m
- Two Means - Unknown Variances Hypothesis Test - Excel12m
- Two Means - Unknown, Equal Variance15m
- Two Means - Unknown, Equal Variances Hypothesis Test - Excel9m
- Two Means - Known Variance12m
- Two Means - Sigma Known Hypothesis Test - Excel21m
- Two Means - Matched Pairs (Dependent Samples)42m
- Matched Pairs Hypothesis Test - Excel12m
- Two Variances and F Distribution29m
- Two Variances - Graphing Calculator16m
- 11. Correlation1h 24m
- 12. Regression3h 33m
- Linear Regression & Least Squares Method26m
- Residuals12m
- Coefficient of Determination12m
- Regression Line Equation and Coefficient of Determination - Excel8m
- Finding Residuals and Creating Residual Plots - Excel11m
- Inferences for Slope31m
- Enabling Data Analysis Toolpak1m
- Regression Readout of the Data Analysis Toolpak - Excel21m
- Prediction Intervals13m
- Prediction Intervals - Excel19m
- Multiple Regression - Excel29m
- Quadratic Regression15m
- Quadratic Regression - Excel10m
- 13. Chi-Square Tests & Goodness of Fit2h 21m
- 14. ANOVA2h 28m
9. Hypothesis Testing for One Sample
Steps in Hypothesis Testing
Problem 13.3.2e
Textbook Question
Hospital Admissions For the matched pairs listed in Exercise 1, identify the following components used in the Wilcoxon signed-ranks test:
e. The value of the test statistic T
 Verified step by step guidance
1
Identify the matched pairs data provided in Exercise 1. The Wilcoxon signed-ranks test is used for paired data to test whether the median difference between pairs is zero.
Calculate the differences between the paired values. For each pair, subtract one value from the other (e.g., difference = value1 - value2).
Ignore the signs of the differences and rank the absolute values of the differences from smallest to largest. Assign ranks to these absolute differences, resolving ties by assigning the average rank to tied values.
Reapply the original signs of the differences to their corresponding ranks. This step ensures that the ranks reflect the direction (positive or negative) of the differences.
Sum the ranks of the positive differences and the ranks of the negative differences separately. The test statistic T is the smaller of these two sums (positive ranks sum or negative ranks sum).
 Verified video answer for a similar problem:
This video solution was recommended by our tutors as helpful for the problem above
Video duration:
3mPlay a video:
0 Comments
Key Concepts
Here are the essential concepts you must grasp in order to answer the question correctly.
Wilcoxon Signed-Ranks Test
The Wilcoxon signed-ranks test is a non-parametric statistical test used to compare two related samples or matched pairs. It assesses whether their population mean ranks differ, making it suitable for data that do not meet the assumptions of normality required for parametric tests. This test is particularly useful in situations where the sample size is small or when the data are ordinal.
Recommended video:
Guided course

Step 2: Calculate Test Statistic
Test Statistic T
In the context of the Wilcoxon signed-ranks test, the test statistic T represents the sum of the ranks of the positive differences between paired observations. This statistic is calculated after ranking the absolute differences between pairs, allowing researchers to determine the significance of the observed differences. A smaller T value indicates a stronger evidence against the null hypothesis of no difference.
Recommended video:
Guided course

Step 2: Calculate Test Statistic
Matched Pairs Design
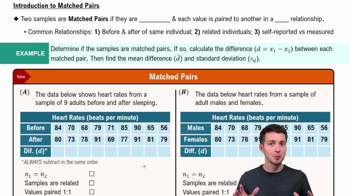
A matched pairs design is a statistical approach where subjects are paired based on certain characteristics, ensuring that each pair is similar in relevant aspects. This design helps control for variability and allows for a more accurate comparison of outcomes between the two conditions being studied. It is commonly used in experiments where the same subjects are measured under different conditions or treatments.
Recommended video:
Guided course

Introduction to Matched Pairs

 6:21m
6:21mWatch next
Master Step 1: Write Hypotheses with a bite sized video explanation from Patrick
Start learningRelated Videos
Related Practice
Textbook Question
