Cola Weights For the four samples described in Exercise 1, the sample of regular Coke has a mean weight of 0.81682 lb, the sample of Diet Coke has a mean weight of 0.78479 lb, the sample of regular Pepsi has a mean weight of 0.82410 lb, and the sample of Diet Pepsi has a mean weight of 0.78386 lb. If we use analysis of variance and reach a conclusion to reject equality of the four sample means, can we then conclude that any of the specific samples have means that are significantly different from the others?
Table of contents
- 1. Intro to Stats and Collecting Data1h 14m
- 2. Describing Data with Tables and Graphs1h 56m
- 3. Describing Data Numerically2h 5m
- 4. Probability2h 16m
- 5. Binomial Distribution & Discrete Random Variables3h 6m
- 6. Normal Distribution and Continuous Random Variables2h 11m
- 7. Sampling Distributions & Confidence Intervals: Mean3h 23m
- Sampling Distribution of the Sample Mean and Central Limit Theorem19m
- Distribution of Sample Mean - Excel23m
- Introduction to Confidence Intervals15m
- Confidence Intervals for Population Mean1h 18m
- Determining the Minimum Sample Size Required12m
- Finding Probabilities and T Critical Values - Excel28m
- Confidence Intervals for Population Means - Excel25m
- 8. Sampling Distributions & Confidence Intervals: Proportion2h 10m
- 9. Hypothesis Testing for One Sample5h 8m
- Steps in Hypothesis Testing1h 6m
- Performing Hypothesis Tests: Means1h 4m
- Hypothesis Testing: Means - Excel42m
- Performing Hypothesis Tests: Proportions37m
- Hypothesis Testing: Proportions - Excel27m
- Performing Hypothesis Tests: Variance12m
- Critical Values and Rejection Regions28m
- Link Between Confidence Intervals and Hypothesis Testing12m
- Type I & Type II Errors16m
- 10. Hypothesis Testing for Two Samples5h 37m
- Two Proportions1h 13m
- Two Proportions Hypothesis Test - Excel28m
- Two Means - Unknown, Unequal Variance1h 3m
- Two Means - Unknown Variances Hypothesis Test - Excel12m
- Two Means - Unknown, Equal Variance15m
- Two Means - Unknown, Equal Variances Hypothesis Test - Excel9m
- Two Means - Known Variance12m
- Two Means - Sigma Known Hypothesis Test - Excel21m
- Two Means - Matched Pairs (Dependent Samples)42m
- Matched Pairs Hypothesis Test - Excel12m
- Two Variances and F Distribution29m
- Two Variances - Graphing Calculator16m
- 11. Correlation1h 24m
- 12. Regression3h 33m
- Linear Regression & Least Squares Method26m
- Residuals12m
- Coefficient of Determination12m
- Regression Line Equation and Coefficient of Determination - Excel8m
- Finding Residuals and Creating Residual Plots - Excel11m
- Inferences for Slope31m
- Enabling Data Analysis Toolpak1m
- Regression Readout of the Data Analysis Toolpak - Excel21m
- Prediction Intervals13m
- Prediction Intervals - Excel19m
- Multiple Regression - Excel29m
- Quadratic Regression15m
- Quadratic Regression - Excel10m
- 13. Chi-Square Tests & Goodness of Fit2h 21m
- 14. ANOVA2h 28m
9. Hypothesis Testing for One Sample
Steps in Hypothesis Testing
Problem 13.2.15
Textbook Question
In Exercises 13–16, refer to the indicated data set in Appendix B and use the sign test for the claim about the median of a population.
Cotinine in Smokers Data Set 15 “Passive and Active Smoke” includes cotinine measurements from 902 smokers. Cotinine is a biomarker of nicotine in the body. Use a 0.01 significance level to test the claim that smokers have cotinine levels with a median of 2.84 ng/mL, which is the median for nonsmokers not exposed to tobacco smoke.
 Verified step by step guidance
1
Step 1: Understand the problem and identify the hypothesis. The claim is that the median cotinine level for smokers is 2.84 ng/mL. This is a two-tailed test because we are testing whether the median is equal to 2.84 ng/mL. The null hypothesis (H₀) is that the median is 2.84 ng/mL, and the alternative hypothesis (H₁) is that the median is not 2.84 ng/mL.
Step 2: Prepare the data for the sign test. For each cotinine measurement in the data set, compare it to the hypothesized median of 2.84 ng/mL. Assign a '+' sign if the measurement is greater than 2.84, a '-' sign if it is less than 2.84, and ignore any measurements equal to 2.84.
Step 3: Count the number of '+' and '-' signs. Let n₊ represent the number of '+' signs and n₋ represent the number of '-' signs. The total number of signs (n) is the sum of n₊ and n₋. Ignore any ties (measurements equal to 2.84) in this count.
Step 4: Determine the test statistic. The test statistic for the sign test is the smaller of n₊ and n₋. This is because the sign test is based on the binomial distribution, and we are testing whether the observed distribution of signs is consistent with the null hypothesis.
Step 5: Compare the test statistic to the critical value or calculate the p-value. At a significance level of 0.01, use the binomial distribution to find the critical value or p-value for the test. If the test statistic is less than or equal to the critical value, or if the p-value is less than 0.01, reject the null hypothesis. Otherwise, fail to reject the null hypothesis.
 Verified video answer for a similar problem:
This video solution was recommended by our tutors as helpful for the problem above
Video duration:
6mPlay a video:
0 Comments
Key Concepts
Here are the essential concepts you must grasp in order to answer the question correctly.
Sign Test
The sign test is a non-parametric statistical method used to evaluate the median of a population. It compares the number of observations above and below a specified median, allowing researchers to determine if there is a significant difference from that median. This test is particularly useful when the data does not meet the assumptions required for parametric tests, such as normality.
Recommended video:
Guided course

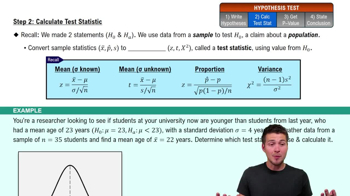
Step 2: Calculate Test Statistic
Median
The median is a measure of central tendency that represents the middle value of a data set when it is ordered from least to greatest. It is less affected by outliers and skewed data than the mean, making it a robust indicator of the typical value in a distribution. In this context, the median cotinine level of 2.84 ng/mL serves as a benchmark for comparison against the cotinine levels of smokers.
Recommended video:
Guided course

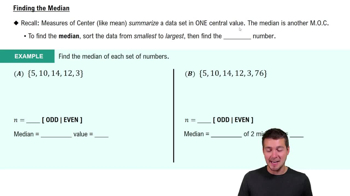
Calculating the Median
Significance Level
The significance level, often denoted as alpha (α), is the threshold for determining whether a statistical result is significant. In this case, a significance level of 0.01 indicates that there is a 1% risk of concluding that a difference exists when there is none (Type I error). This stringent level is used to assess the strength of evidence against the null hypothesis, which posits that the median cotinine level for smokers is equal to that of nonsmokers.
Recommended video:
Guided course

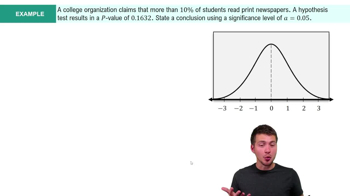
Step 4: State Conclusion Example 4

 6:21m
6:21mWatch next
Master Step 1: Write Hypotheses with a bite sized video explanation from Patrick
Start learningRelated Videos
Related Practice
Textbook Question
