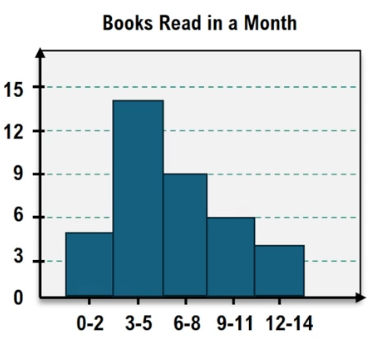
Histograms are a powerful tool for visualizing quantitative data, serving as a graphical representation of frequency distributions. A frequency distribution organizes data into classes or bins, allowing for easier identification of patterns and trends compared to raw numerical tables. To create a histogram, one must first establish a frequency distribution table, which lists the classes and their corresponding frequencies.
In constructing a histogram, the x-axis represents the class midpoints, calculated by averaging the upper and lower limits of each class. For example, for a class range of 20 to 29, the midpoint would be \( \frac{20 + 29}{2} = 24.5 \). The y-axis displays the frequencies, denoted as \( f \), which indicate how many data points fall within each class. Bars are then drawn for each class, with heights corresponding to their frequencies. It is important that these bars touch, as this visually emphasizes the continuous nature of the data.
When analyzing the shape of a histogram, there are four common distribution types to consider: normal, skewed right, skewed left, and uniform. A normal distribution is characterized by a bell-shaped curve, where data is symmetrically distributed around the mean, with most values clustering around the center. In contrast, a skewed right distribution has a peak on the left and a tail extending to the right, often seen in income data where a few high earners skew the average. Conversely, a skewed left distribution peaks on the right and trails off to the left, commonly observed in life expectancy data. Lastly, a uniform distribution occurs when all classes have approximately equal frequencies, such as in the case of rolling dice.
By examining the shape of a histogram, one can determine the underlying distribution of the data. For instance, if a histogram peaks in the middle and tapers off symmetrically, it indicates a normal distribution. Understanding these concepts is crucial for effectively interpreting data and making informed decisions based on statistical analysis.


