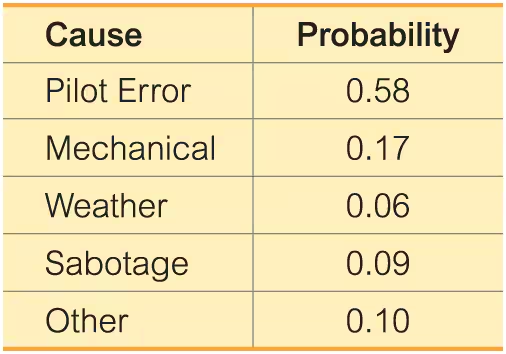
A company tracks the number of complaints they receive, where the random variable X is the number of complaints received daily. Find the variance & standard deviation of this distribution.
Table of contents
- 1. Intro to Stats and Collecting Data1h 14m
- 2. Describing Data with Tables and Graphs1h 55m
- 3. Describing Data Numerically2h 5m
- 4. Probability2h 16m
- 5. Binomial Distribution & Discrete Random Variables3h 6m
- 6. Normal Distribution and Continuous Random Variables2h 11m
- 7. Sampling Distributions & Confidence Intervals: Mean3h 23m
- Sampling Distribution of the Sample Mean and Central Limit Theorem19m
- Distribution of Sample Mean - Excel23m
- Introduction to Confidence Intervals15m
- Confidence Intervals for Population Mean1h 18m
- Determining the Minimum Sample Size Required12m
- Finding Probabilities and T Critical Values - Excel28m
- Confidence Intervals for Population Means - Excel25m
- 8. Sampling Distributions & Confidence Intervals: Proportion1h 12m
- 9. Hypothesis Testing for One Sample3h 29m
- 10. Hypothesis Testing for Two Samples4h 50m
- Two Proportions1h 13m
- Two Proportions Hypothesis Test - Excel28m
- Two Means - Unknown, Unequal Variance1h 3m
- Two Means - Unknown Variances Hypothesis Test - Excel12m
- Two Means - Unknown, Equal Variance15m
- Two Means - Unknown, Equal Variances Hypothesis Test - Excel9m
- Two Means - Known Variance12m
- Two Means - Sigma Known Hypothesis Test - Excel21m
- Two Means - Matched Pairs (Dependent Samples)42m
- Matched Pairs Hypothesis Test - Excel12m
- 11. Correlation1h 6m
- 12. Regression1h 50m
- 13. Chi-Square Tests & Goodness of Fit1h 57m
- 14. ANOVA1h 57m
5. Binomial Distribution & Discrete Random Variables
Discrete Random Variables
Problem 5.1.7
Textbook Question
Identifying Probability Distributions. In Exercises 7–14, determine whether a probability distribution is given. If a probability distribution is given, find its mean and standard deviation. If a probability distribution is not given, identify the requirements that are not satisfied.
Plane Crashes The table lists causes of fatal plane crashes with their corresponding probabilities.

Verified step by step guidance1
Step 1: Verify if the given data represents a probability distribution. To do this, check two key requirements: (a) All probabilities must be between 0 and 1, and (b) The sum of all probabilities must equal 1.
Step 2: Add the probabilities provided in the table: Pilot Error (0.58), Mechanical (0.17), Weather (0.06), Sabotage (0.09), and Other (0.10). Use the formula: \( \text{Sum} = P_1 + P_2 + P_3 + P_4 + P_5 \).
Step 3: If the sum of probabilities equals 1 and all probabilities are between 0 and 1, confirm that the data represents a probability distribution. If not, identify which requirement is violated.
Step 4: To find the mean of the probability distribution, use the formula \( \mu = \sum (x \cdot P(x)) \), where \( x \) represents the causes (numerical values assigned to each category) and \( P(x) \) represents the probabilities.
Step 5: To find the standard deviation, use the formula \( \sigma = \sqrt{\sum (x^2 \cdot P(x)) - \mu^2} \). Calculate \( \sum (x^2 \cdot P(x)) \), subtract \( \mu^2 \), and take the square root of the result.
Verified video answer for a similar problem:This video solution was recommended by our tutors as helpful for the problem above
Video duration:
2mPlay a video:
Was this helpful?
Key Concepts
Here are the essential concepts you must grasp in order to answer the question correctly.
Probability Distribution
A probability distribution is a mathematical function that provides the probabilities of occurrence of different possible outcomes in an experiment. For a set of outcomes to qualify as a probability distribution, the sum of all probabilities must equal 1, and each individual probability must be between 0 and 1. In the context of the plane crash causes, we need to verify if these conditions are met.
Recommended video:
Guided course
Calculating Probabilities in a Binomial Distribution
Mean of a Probability Distribution
The mean of a probability distribution, also known as the expected value, is a measure of the central tendency of the distribution. It is calculated by multiplying each outcome by its probability and summing these products. In this case, if the distribution is valid, we would compute the mean to understand the average cause of plane crashes based on the given probabilities.
Recommended video:
Guided course
Mean & Standard Deviation of Binomial Distribution
Standard Deviation of a Probability Distribution
The standard deviation of a probability distribution quantifies the amount of variation or dispersion of the outcomes. It is calculated by taking the square root of the variance, which is the average of the squared differences from the mean. Understanding the standard deviation helps assess the reliability of the probabilities associated with the causes of plane crashes.
Recommended video:
Guided course
Calculating Standard Deviation
Watch next
Master Intro to Random Variables & Probability Distributions with a bite sized video explanation from Patrick
Start learningRelated Videos
Related Practice
Multiple Choice
