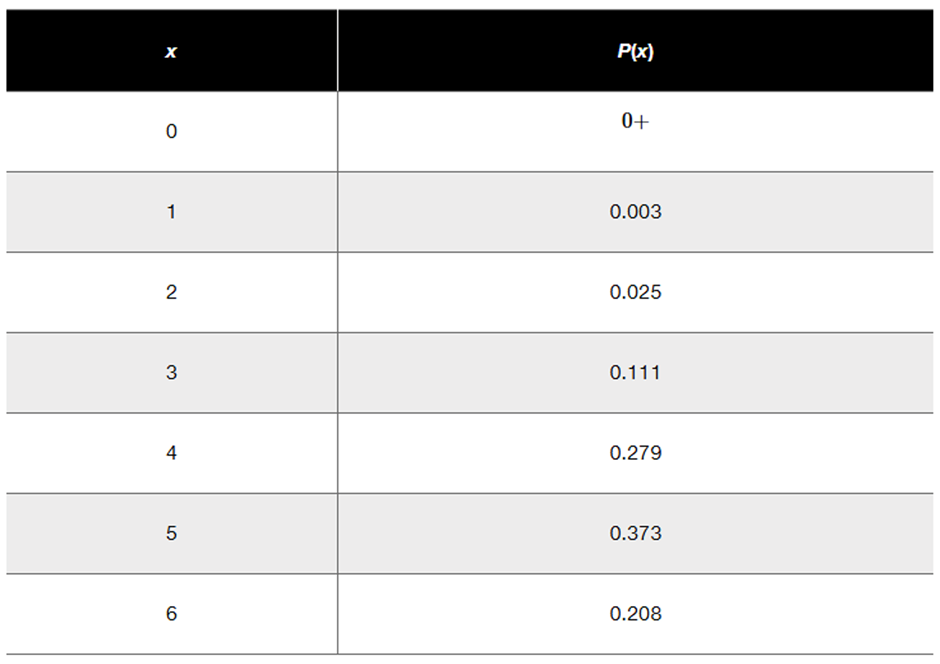
A factory produces lightbulbs in batches of 50. The probability distribution for the number of defective lightbulbs in a randomly selected batch is shown below. Find the expected value.
Table of contents
- 1. Intro to Stats and Collecting Data55m
- 2. Describing Data with Tables and Graphs1h 55m
- 3. Describing Data Numerically1h 45m
- 4. Probability2h 16m
- 5. Binomial Distribution & Discrete Random Variables2h 33m
- 6. Normal Distribution and Continuous Random Variables1h 38m
- 7. Sampling Distributions & Confidence Intervals: Mean1h 53m
- 8. Sampling Distributions & Confidence Intervals: Proportion1h 12m
- 9. Hypothesis Testing for One Sample2h 19m
- 10. Hypothesis Testing for Two Samples3h 22m
- 11. Correlation1h 6m
- 12. Regression1h 4m
- 13. Chi-Square Tests & Goodness of Fit1h 20m
- 14. ANOVA1h 0m
5. Binomial Distribution & Discrete Random Variables
Discrete Random Variables
Problem 5.RE.8
Textbook Question
Family/Partner Groups of people aged 15–65 are randomly selected and arranged in groups of six. The random variable x is the number in the group who say that their family and/or partner contribute most to their happiness (based on a Coca-Cola survey). The accompanying table lists the values of x along with their corresponding probabilities. Does the table describe a probability distribution? If so, find the mean and standard deviation.


1
Step 1: Verify if the table describes a probability distribution. To do this, check two conditions: (a) All probabilities P(x) must be between 0 and 1, inclusive, and (b) The sum of all probabilities P(x) must equal 1.
Step 2: Calculate the sum of all probabilities P(x) from the table: \( P(0) + P(1) + P(2) + P(3) + P(4) + P(5) + P(6) \). Ensure the sum equals 1 to confirm it is a valid probability distribution.
Step 3: To find the mean (expected value), use the formula \( \mu = \sum [x \cdot P(x)] \), where \( x \) is the value of the random variable and \( P(x) \) is its corresponding probability. Multiply each \( x \) by its \( P(x) \), then sum the results.
Step 4: To find the variance, use the formula \( \sigma^2 = \sum [(x - \mu)^2 \cdot P(x)] \). Subtract the mean \( \mu \) from each \( x \), square the result, multiply by \( P(x) \), and sum these values.
Step 5: To find the standard deviation, take the square root of the variance: \( \sigma = \sqrt{\sigma^2} \). This provides the measure of spread for the probability distribution.

This video solution was recommended by our tutors as helpful for the problem above
Video duration:
3mPlay a video:
Was this helpful?
Key Concepts
Here are the essential concepts you must grasp in order to answer the question correctly.
Probability Distribution
A probability distribution describes how the probabilities are distributed over the values of a random variable. For a valid probability distribution, the sum of all probabilities must equal 1, and each individual probability must be between 0 and 1. In this case, we need to check if the probabilities listed for the values of x (0 to 6) meet these criteria.
Recommended video:
Guided course
Calculating Probabilities in a Binomial Distribution
Mean of a Probability Distribution
The mean, or expected value, of a probability distribution is calculated by multiplying each value of the random variable by its corresponding probability and then summing these products. This provides a measure of the central tendency of the distribution, indicating the average outcome one can expect if the experiment is repeated many times.
Recommended video:
Guided course
Mean & Standard Deviation of Binomial Distribution
Standard Deviation of a Probability Distribution
The standard deviation measures the dispersion or spread of a probability distribution around its mean. It is calculated by taking the square root of the variance, which is the average of the squared differences between each value and the mean, weighted by their probabilities. A higher standard deviation indicates greater variability in the outcomes.
Recommended video:
Guided course
Calculating Standard Deviation
Watch next
Master Intro to Random Variables & Probability Distributions with a bite sized video explanation from Patrick
Start learningRelated Videos
Related Practice
Multiple Choice