The table shows the ages of students in a freshman orientation course.
b. Graph the probability distribution using a histogram and describe its shape.
 Verified step by step guidance
 Verified video answer for a similar problem:


 7:09m
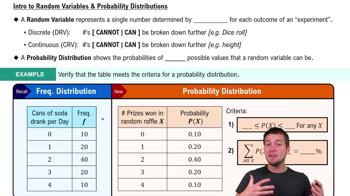
7:09mMaster Intro to Random Variables & Probability Distributions with a bite sized video explanation from Patrick
Start learning