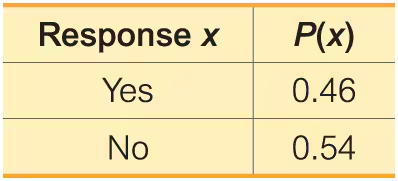
Discrete or Continuous? Is the random variable given in the table from Exercise 1 discrete or continuous? Explain.
Table of contents
- 1. Intro to Stats and Collecting Data55m
- 2. Describing Data with Tables and Graphs1h 55m
- 3. Describing Data Numerically1h 45m
- 4. Probability2h 16m
- 5. Binomial Distribution & Discrete Random Variables2h 33m
- 6. Normal Distribution and Continuous Random Variables1h 38m
- 7. Sampling Distributions & Confidence Intervals: Mean1h 53m
- 8. Sampling Distributions & Confidence Intervals: Proportion1h 12m
- 9. Hypothesis Testing for One Sample2h 19m
- 10. Hypothesis Testing for Two Samples3h 22m
- 11. Correlation1h 6m
- 12. Regression1h 4m
- 13. Chi-Square Tests & Goodness of Fit1h 20m
- 14. ANOVA1h 0m
5. Binomial Distribution & Discrete Random Variables
Discrete Random Variables
Problem 5.1.12
Textbook Question
Identifying Probability Distributions. In Exercises 7–14, determine whether a probability distribution is given. If a probability distribution is given, find its mean and standard deviation. If a probability distribution is not given, identify the requirements that are not satisfied.
Fear of Heights The table lists results from a survey of 285 subjects who were asked, “Are you afraid of heights in tall buildings?” The results are from USA Today.


1
Step 1: Verify if the given table represents a probability distribution. To do this, check two key requirements: (a) All probabilities P(x) must be between 0 and 1, and (b) The sum of all probabilities P(x) must equal 1.
Step 2: Add the probabilities provided in the table: P(Yes) = 0.46 and P(No) = 0.54. Use the formula: ∑P(x) = P(Yes) + P(No).
Step 3: If the sum of probabilities equals 1 and all probabilities are between 0 and 1, confirm that the table represents a valid probability distribution. If not, identify which requirement is violated.
Step 4: To find the mean (expected value) of the distribution, use the formula: E(X) = ∑[x * P(x)], where x represents the response values (assign numerical values such as Yes = 1, No = 0) and P(x) represents the probabilities.
Step 5: To find the standard deviation, use the formula: σ = √∑[(x - E(X))² * P(x)], where E(X) is the mean calculated in Step 4, and x and P(x) are the response values and probabilities respectively.

This video solution was recommended by our tutors as helpful for the problem above
Video duration:
4mPlay a video:
Was this helpful?
Key Concepts
Here are the essential concepts you must grasp in order to answer the question correctly.
Probability Distribution
A probability distribution describes how the probabilities of a random variable are distributed across its possible values. For a valid probability distribution, the sum of all probabilities must equal 1, and each individual probability must be between 0 and 1. In the given survey results, the probabilities for 'Yes' and 'No' responses sum to 1, indicating a valid probability distribution.
Recommended video:
Guided course
Calculating Probabilities in a Binomial Distribution
Mean of a Probability Distribution
The mean, or expected value, of a probability distribution is a measure of the central tendency of the random variable. It is calculated by multiplying each possible value by its corresponding probability and summing these products. In this case, the mean would provide insight into the average response regarding fear of heights based on the survey data.
Recommended video:
Guided course
Mean & Standard Deviation of Binomial Distribution
Standard Deviation of a Probability Distribution
The standard deviation measures the dispersion or spread of a probability distribution around its mean. It quantifies how much the values of the random variable deviate from the expected value. A low standard deviation indicates that the values are close to the mean, while a high standard deviation suggests a wider spread of responses, which can be calculated using the probabilities and their respective outcomes.
Recommended video:
Guided course
Calculating Standard Deviation
Watch next
Master Intro to Random Variables & Probability Distributions with a bite sized video explanation from Patrick
Start learningRelated Videos
Related Practice
Textbook Question