

Textbook Question
The heights (in feet) and the number of stories of the ten tallest buildings in New York City are listed. Use a scatter plot to display the data. Describe any patterns. (Source: Emporis)
The most frequent number of books read: 2
The least frequent number of books read: 6
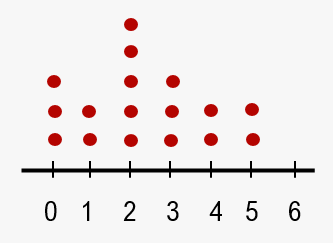
The most frequent number of books read: 2
The least frequent number of books read: 1,4,5
The most frequent number of books read: 5
The least frequent number of books read: 1,4,5
The most frequent number of books read: 5
The least frequent number of books read: 6
The most frequent number of books read: 2
The least frequent number of books read: 0
 Verified step by step guidance
