Multiple Choice
Using the frequency polygon below, what range of test scores was most popular?
 Verified step by step guidanceVerified video answer for a similar problem:
 06:38
06:38 05:18
05:18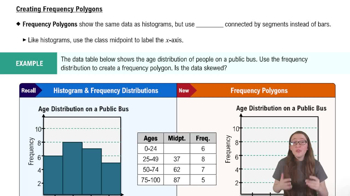 04:41
04:41 4:41m
4:41mMaster Creating Frequency Polygons with a bite sized video explanation from Patrick
Start learning