The data set represents the number of minutes a sample of 27 people exercise each week.
108 139 120 123 120 132 123 131 131
157 150 124 111 101 135 119 116 117
127 128 139 119 118 114 127 142 130
g. Display the data using a box-and-whisker plot.

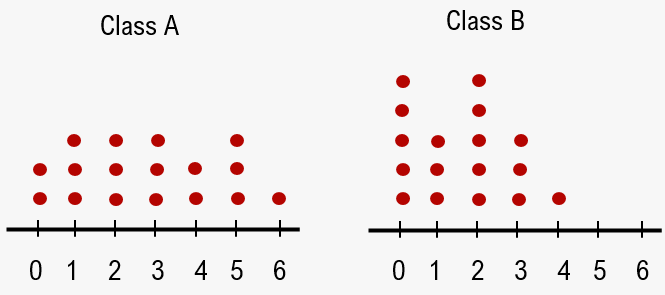
Class A
Class B
Both Class A and Class B
 Verified step by step guidance