One-Sided Confidence Interval A one-sided claim about a population proportion is a claim that the proportion is less than (or greater than) some specific value. Such a claim can be formally addressed using a one-sided confidence interval for p, which can be expressed as p<p+E or p>p-E, where the margin of error E is modified by replacing za/2 with za. (Instead of dividing between two tails of the standard normal distribution, put all of it in one tail.) The Chapter Problem refers to a Sallie Mae survey of 950 undergraduate students, and 53% of the survey subjects take online courses. Use that data to construct a one-sided 95% confidence interval that would be suitable for helping to determine whether the percentage of all undergraduates who take online courses is greater than 50%.
8. Sampling Distributions & Confidence Intervals: Proportion
Confidence Intervals for Population Proportion
Problem 7.4.6
Textbook Question
Seating Choice In a 3M Privacy Filters poll, respondents were asked to identify their favorite seat when they fly, and the results include these responses: window, window, other, other. Letting “window” and letting “other”, those four responses can be represented as {1, 1, 0, 0}. Here are ten bootstrap samples for those responses: [Image]
Using only the ten given bootstrap samples, construct an 80% confidence interval estimate of the proportion of respondents who indicated their favorite seat is “window.”
 Verified step by step guidance
1
Step 1: Understand the problem. The goal is to construct an 80% confidence interval for the proportion of respondents who prefer the 'window' seat using the given bootstrap samples. Each bootstrap sample represents a resampling of the original data with replacement.
Step 2: Calculate the proportion of 'window' responses (represented as 1s) for each bootstrap sample. For each sample, count the number of 1s and divide by the total number of responses in that sample. Use the formula: , where is the count of 'window' responses and is the total number of responses in the sample.
Step 3: Organize the proportions calculated in Step 2 into a list. These proportions represent the bootstrap estimates of the proportion of 'window' preferences.
Step 4: Determine the 80% confidence interval. To do this, sort the list of bootstrap proportions in ascending order. Identify the lower and upper bounds of the interval by finding the 10th and 90th percentiles of the sorted proportions. This corresponds to the middle 80% of the bootstrap distribution.
Step 5: Report the confidence interval. The interval will be expressed as [lower bound, upper bound], where the lower bound is the 10th percentile and the upper bound is the 90th percentile of the bootstrap proportions. This interval provides an estimate of the proportion of respondents who prefer the 'window' seat with 80% confidence.
Verified video answer for a similar problem:This video solution was recommended by our tutors as helpful for the problem above
Video duration:
5mKey Concepts
Here are the essential concepts you must grasp in order to answer the question correctly.
Bootstrap Sampling
Bootstrap sampling is a resampling technique used to estimate the distribution of a statistic by repeatedly sampling with replacement from the original data. This method allows for the creation of multiple simulated samples, which can help in estimating confidence intervals and assessing the variability of a statistic, such as the proportion of respondents favoring a particular choice.
Recommended video:

 05:11
05:11Sampling Distribution of Sample Proportion
Confidence Interval
A confidence interval is a range of values, derived from sample statistics, that is likely to contain the true population parameter with a specified level of confidence, such as 80%. It provides an estimate of uncertainty around a sample statistic, allowing researchers to make inferences about the population based on sample data.
Recommended video:
 06:33
06:33Introduction to Confidence Intervals
Proportion
Proportion is a statistical measure that represents the fraction of a whole, often expressed as a percentage. In the context of survey responses, it indicates the ratio of respondents who selected a particular option (e.g., 'window') compared to the total number of respondents. Understanding proportions is essential for analyzing categorical data and making comparisons.
Recommended video:
Guided course
 09:27
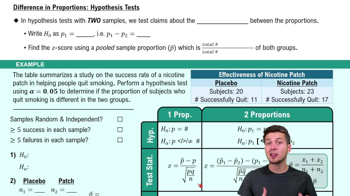
09:27Difference in Proportions: Hypothesis Tests
 5:45m
5:45mWatch next
Master Constructing Confidence Intervals for Proportions with a bite sized video explanation from Patrick
Start learningRelated Videos
Related Practice
Textbook Question