Back
BackProblem 3.4.37
37. Water Pollution An environmental agency is analyzing water samples from 80 lakes for pollution. Five of the lakes have dangerously high levels of dioxin. Six lakes are randomly selected from the sample. Use technology to find how many ways one polluted lake and five nonpolluted lakes can be chosen.
Problem 3.2.12
"Classifying Events as Independent or Dependent In Exercises 9-14, determine whether the events are independent or dependent. Explain your reasoning.
12. Not putting money in a parking meter and getting a parking ticket"
Problem 3.2.2
"2. Give an example of
a. two events that are independent.
b. two events that are dependent."
Problem 3.1.71
Boy or Girl? In Exercises 71-74, a couple plans to have three children. Each child is equally likely to be a boy or a girl.
71. What is the probability that all three children are girls?
Problem 3.1.26
"Identifying the Sample Space of a Probability Experiment In Exercises 25-32, identify the sample space of the probability experiment and determine the number of outcomes in the sample space. Draw a tree diagram when appropriate.
26. Guessing a student's letter grade (A, B, C, D, F) in a class
"
Problem 3.1.34
Identifying Simple Events In Exercises 33-36, determine the number of outcomes in the event. Then decide whether the event is a simple event or not. Explain your reasoning.
34. A spreadsheet is used to randomly generate a number from 1 to 4000. Event B is generating a number less than 500.
Problem 3.1.37
Using the Fundamental Counting Principle In Exercises 37-40, use the Fundamental Counting Principle.
37. Menu A restaurant offers a $15 dinner special that lets you choose from 6 appetizers, 12 entrées, and 8 desserts. How many different meals are available when you select an appetizer, an entrée, and a dessert?
Problem 3.4.20
20. Skating Eight people compete in a short track speed skating race. Assuming that there are no ties, in how many different orders can the skaters finish?
Problem 3.1.58
Classifying Types of Probability In Exercises 53-58, classify the statement as an example of classical probability, empirical probability, or subjective probability. Explain your reasoning.
58. You estimate that the probability of getting all the classes you want on your next schedule
is about 25%.
Problem 3.3.10
Recognizing Mutually Exclusive Events In Exercises 9–12, determine whether the events are mutually exclusive. Explain your reasoning.
10. Event A: Randomly select a student with a birthday in April.
Event B: Randomly select a student with a birthday in May.
Problem 3.2.14
Classifying Events as Independent or Dependent In Exercises 9-14, determine whether the events are independent or dependent. Explain your reasoning.
14. A ball is selected from a bin of balls numbered from 1 through 52. It is replaced, and then a second numbered ball is selected from the bin.
Problem 3.4.47
Finding New Music In Exercises 45–48, use the pie chart, which shows the results of a survey of 513 music listeners who were asked about their primary source for new music. (Source: The Sound of AI)
<IMAGE>
47. You choose nine music listeners at random. What is the probability that none of them say their primary source for new music is friends or social media?
Problem 3.2.34
"According to Bayes’ Theorem, the probability of event A , given that event B has occurred, is
P(A|B) = P(A) * P(B|A)P(A) * P(B|A) + P(A') * P(B|A').
In Exercises 33–38, use Bayes’ Theorem to find P(A|B).
34. P(A) = 3/8, P(A') = 5/8, P(B|A) = 2/3 , and P(B|A') = 3/5 "
Problem 3.2.1
3. What does the notation P(B|A) mean?
Problem 3.1.92
Odds The chances of winning are often written in terms of odds rather than probabilities. The odds of winning is the ratio of the number of successful outcomes to the number of unsuccessful outcomes. The odds of losing is the ratio of the number of unsuccessful outcomes to the number of successful outcomes. For example, when the number of successful outcomes is 2 and the number of unsuccessful outcomes is 3, the odds of winning are 2 : 3 (read "2 to 3"). In Exercises 91-96, use this information about odds.
92. The probability of winning an instant prize game is 1/10. The odds of winning a different instant prize game are 1 : 10. You want the best chance of winning. Which game should you play? Explain your reasoning.
Problem 3.3.1
1. When two events are mutually exclusive, why is P(A and B) = 0?
Problem 3.3.7
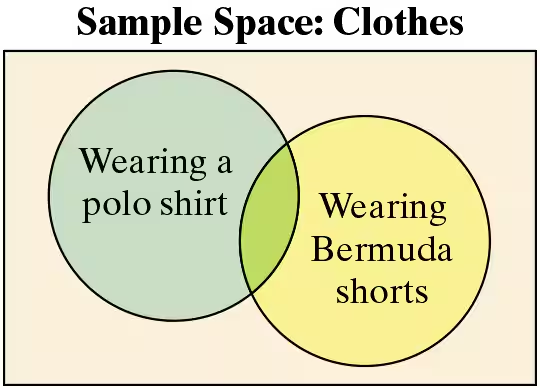
Graphical Analysis In Exercises 7 and 8, determine whether the events shown in the Venn diagram are mutually exclusive. Explain your reasoning.
Problem 3.4.3
True or False? In Exercises 3-6, determine whether the statement is true or false. If it is false, rewrite it as a true statement.
3. A combination is an ordered arrangement of objects.
Problem 3.1.25
Identifying the Sample Space of a Probability Experiment In Exercises 25-32, identify the sample space of the probability experiment and determine the number of outcomes in the sample space. Draw a tree diagram when appropriate.
25. Guessing the initial of a student's middle name
Problem 3.1.80
80. Unusual Events Can any of the events in Exercises 75-78 be considered unusual? Explain.
Problem 3.1.90
Writing In Exercises 89 and 90, write a statement that represents the complement of the probability.
90. The probability of randomly choosing a car with more than one cause for showing its "CHECK ENGINE" light from the population of vehicles showing "CHECK ENGINE" lights.
Problem 3.1.19
Finding the Probability of the Complement of an Event In Exercises 17-20, the probability that an event will happen is given. Find the probability that the event will not happen.
19. P(E)=0.03
Problem 3.1.84
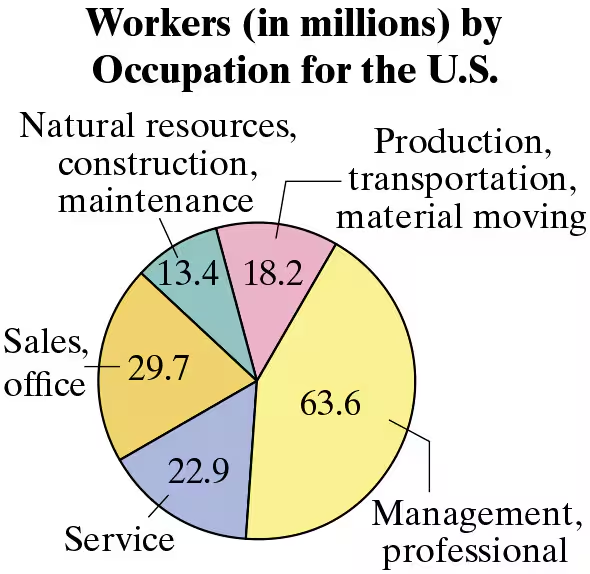
Using a Pie Chart to Find Probabilities In Exercises 83-86, use the pie chart at the left, which shows the number of workers (in millions) by occupation for the United States. (Source: U.S. Bureau of Labor Statistics)
84. Find the probability that a worker chosen at random is not employed in a service occupation.
Problem 3.CR.14c
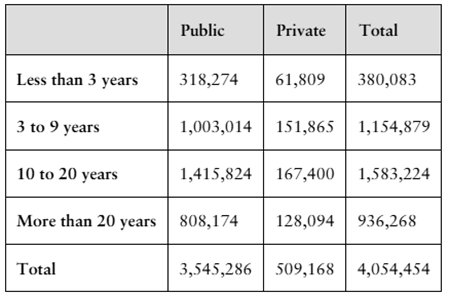
The table shows the results of a survey in which 3,545,286 public and 509,168 private school teachers were asked about their full-time teaching experience.
Are the events “being a public school teacher” and “having more than 20 years of full-time teaching experience” independent? Explain.
Problem 3.Q.4
4. Determine whether the events are mutually exclusive. Then determine whether the events are independent or dependent. Explain your reasoning.
Event A: A bowler having the highest game in a 40-game tournament
Event B: Losing the bowling tournament
Problem 3.Q.6c
6. A shipment of 250 netbooks contains 3 defective units. Determine how many ways a vending company can buy three of these units and receive
c. at least one good unit.
Problem 3.Q.2a
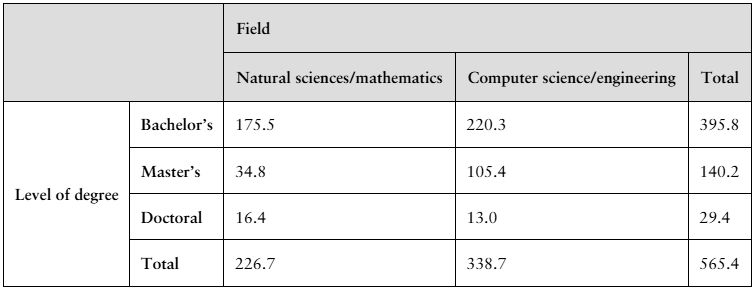
The table shows the numbers (in thousands) of earned degrees by level in two different fields, conferred in the United States in a recent year. (Source: U.S. National Center for Education Statistics)
A person who earned a degree in the year is randomly selected. Find the probability that the degree earned by the person is a
a. bachelor's degree.
Problem 3.Q.2e
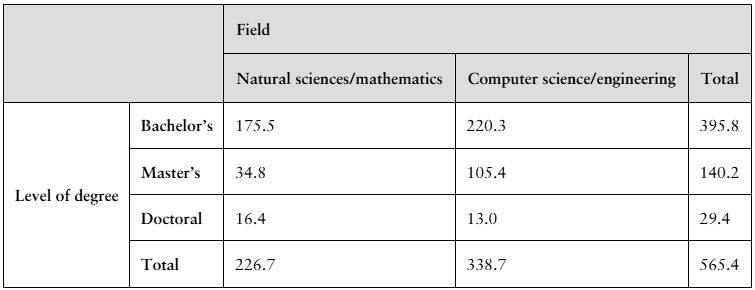
The table shows the numbers (in thousands) of earned degrees by level in two different fields, conferred in the United States in a recent year. (Source: U.S. National Center for Education Statistics)
A person who earned a degree in the year is randomly selected. Find the probability that the degree earned by the person is a
g. bachelor's degree and the degree is in natural sciences/mathematics.
Problem 3.Q.2h
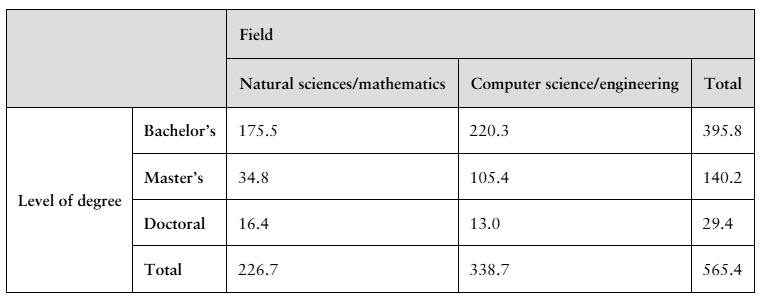
The table shows the numbers (in thousands) of earned degrees by level in two different fields, conferred in the United States in a recent year. (Source: U.S. National Center for Education Statistics)
A person who earned a degree in the year is randomly selected. Find the probability that the degree earned by the person is a
g. bachelor's degree and the degree is in natural sciences/mathematics.
Problem 3.R.48
In Exercises 45-48, use combinations and permutations.
48. An employer must hire 2 people from a list of 13 applicants. In how many ways can the employer choose to hire the two people?