Here are the essential concepts you must grasp in order to answer the question correctly.
Box-and-Whisker Plot
A box-and-whisker plot is a graphical representation of a dataset that displays its minimum, first quartile, median, third quartile, and maximum. The 'box' shows the interquartile range (IQR), which contains the middle 50% of the data, while the 'whiskers' extend to the minimum and maximum values. This visualization helps in understanding the distribution and spread of the data.
Recommended video:
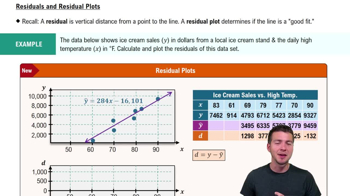
Residuals and Residual Plots
Probability
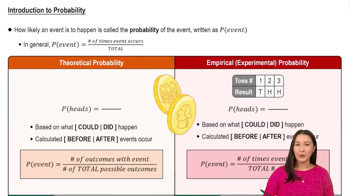
Probability is a measure of the likelihood that a particular event will occur, expressed as a number between 0 and 1. In this context, it refers to the chance of randomly selecting a stock price that falls within a specified range, calculated by dividing the number of favorable outcomes by the total number of possible outcomes.
Recommended video:
Introduction to Probability
Interquartile Range (IQR)
The interquartile range (IQR) is the difference between the first quartile (Q1) and the third quartile (Q3) in a dataset, representing the range of the middle 50% of the data. It is a key measure of statistical dispersion, indicating how spread out the values are, and is crucial for determining the probability of a stock price falling within a specific range.
Recommended video:
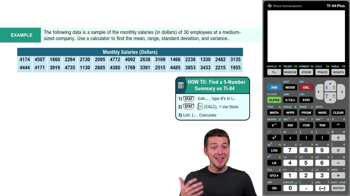
Find 5-Number Summary - TI-84 Calculator Example 1