Back
BackProblem 2.3.12
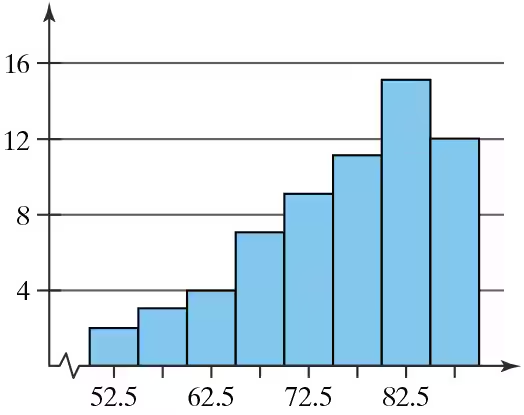
Graphical Analysis In Exercises 9–12, determine whether the approximate shape of the distribution in the histogram is symmetric, uniform, skewed left, skewed right, or none of these. Justify your answer.
Problem 2.3.3
Building Basic Skills and Vocabulary
True or False? In Exercises 1– 4, determine whether the statement is true or false. If it is false, rewrite it as a true statement.
A data set can have the same mean, median, and mode.
Problem 2.3.6
Constructing Data Sets In Exercises 5– 8, construct the described data set. The entries in the data set cannot all be the same.
Mean and median are the same and the data is bimodal.
Problem 2.3.22
Using and Interpreting Concepts
Finding and Discussing the Mean, Median, and Mode In Exercises 17–34, find the mean, the median, and the mode of the data, if possible. If any measure cannot be found or does not represent the center of the data, explain why.
Cholesterol The cholesterol levels of a sample of 10 female employees
154 240 171 188 235 203 184 173 181 275
Problem 2.3.25
Using and Interpreting Concepts
Finding and Discussing the Mean, Median, and Mode In Exercises 17–34, find the mean, the median, and the mode of the data, if possible. If any measure cannot be found or does not represent the center of the data, explain why.
Power Failures The durations (in minutes) of power failures at a residence in the last 10 years
18 26 45 75 125 80 33
40 44 49 89 80 96 125
12 61 31 63 103 28 19
Problem 2.3.28
Using and Interpreting Concepts
Finding and Discussing the Mean, Median, and Mode In Exercises 17–34, find the mean, the median, and the mode of the data, if possible. If any measure cannot be found or does not represent the center of the data, explain why.
Judicial System The responses of a sample of 34 young adult United Kingdom males in custodial sentences who were asked what is affected by such sentences (Adapted from User Voice)
Mental health: 8
Trust: 3
Education: 8
Personal development: 5
Family: 3
Future opportunities: 3
Other: 4
Problem 2.3.31
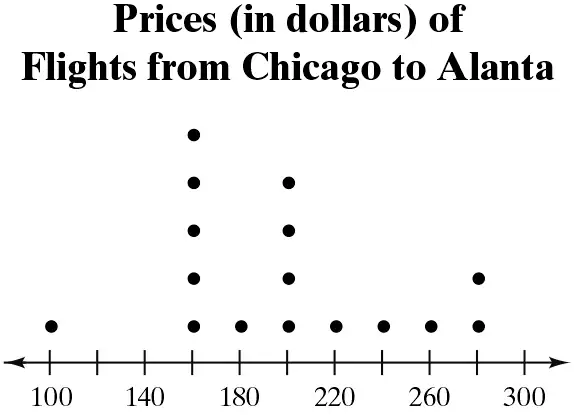
Using and Interpreting Concepts
Finding and Discussing the Mean, Median, and Mode In Exercises 17–34, find the mean, the median, and the mode of the data, if possible. If any measure cannot be found or does not represent the center of the data, explain why.
Weights (in pounds) of Packages on a Delivery Truck
Problem 2.3.34
Using and Interpreting Concepts
Finding and Discussing the Mean, Median, and Mode In Exercises 17–34, find the mean, the median, and the mode of the data, if possible. If any measure cannot be found or does not represent the center of the data, explain why.
Prices (in dollars) of Flights from Chicago to Alanta
Problem 2.3.37
In Exercises 37– 40, without performing any calculations, determine which measure of central tendency best represents the graphed data. Explain your reasoning.
Problem 2.3.57a
Protein Powder During a quality assurance check, the actual contents (in grams) of six containers of protein powder were recorded as 1525, 1526, 1502, 1516, 1529, and 1511.
a. Find the mean and the median of the contents.
Problem 2.3.58a
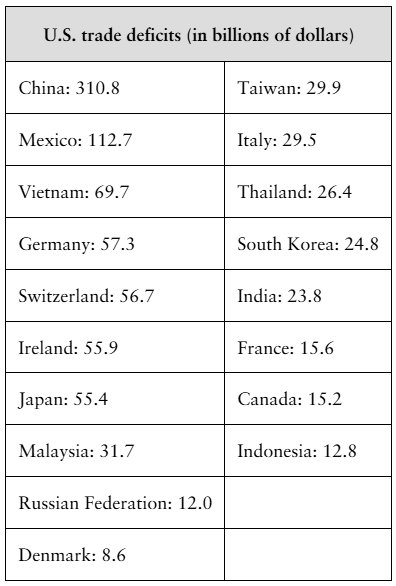
U.S. Trade Deficits The table at the left shows the U.S. trade deficits (in billions of dollars) with 18 countries in 2020. (Source: U.S. Department of Commerce)
a. Find the mean and the median of the trade deficits.
Problem 2.3.62a
Extending Concepts
Golf The distances (in yards) for nine holes of a golf course are listed.
336 393 408 522 147 504 177 375 360
a. Find the mean and the median of the data.
Problem 2.3.59
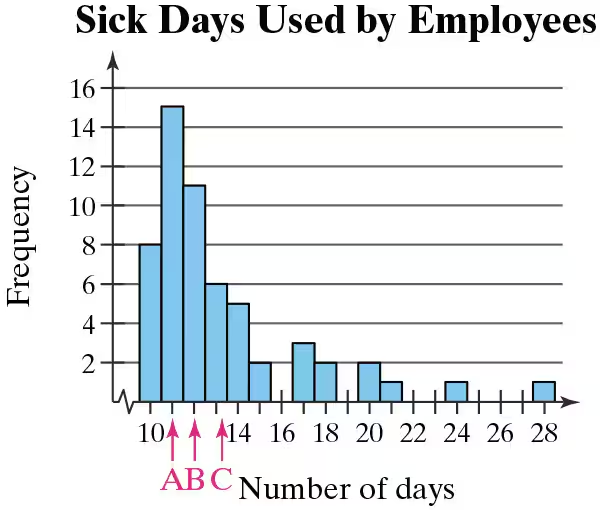
Graphical Analysis In Exercises 59 and 60, the letters A, B, and C are marked on the horizontal axis. Describe the shape of the data. Then determine which is the mean, which is the median, and which is the mode. Justify your answers.
Problem 2.3.65a
Extending Concepts
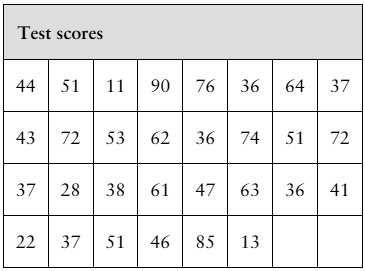
Data Analysis Students in an experimental psychology class did research on depression as a sign of stress. A test was administered to a sample of 30 students. The scores are shown in the table at the left.
a. Find the mean and the median of the data.
Problem 2.3.17
Using and Interpreting Concepts
Finding and Discussing the Mean, Median, and Mode In Exercises 17–34, find the mean, the median, and the mode of the data, if possible. If any measure cannot be found or does not represent the center of the data, explain why.
College Credits The number of credits being taken by a sample of 14 full-time college students for a semester
12 14 16 15 13 14 15
18 16 16 12 16 15 17
Problem 2.3.46
Finding a Weighted Mean In Exercises 41– 46, find the weighted mean of the data.
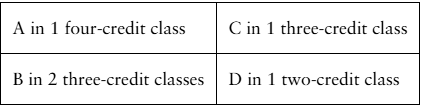
Grades A student receives the grades shown below, with an A worth 4 points, a B worth 3 points, a C worth 2 points, and a D worth 1 point. What is the student’s grade point average?
Problem 2.3.48
Grades In Exercise 46, one of the student’s B grades gets changed to an A. What is the student’s new grade point average?
Problem 2.3.50
Finding the Mean of a Frequency Distribution In Exercises 49–52, approximate the mean of the frequency distribution.
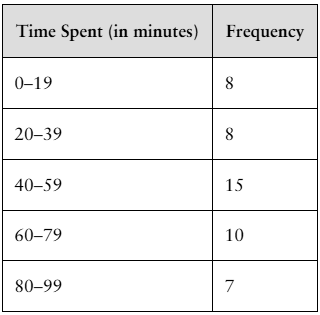
Social Media The average daily amounts of time (in minutes) spent on Snapchat
Problem 2.3.52
Finding the Mean of a Frequency Distribution In Exercises 49–52, approximate the mean of the frequency distribution.
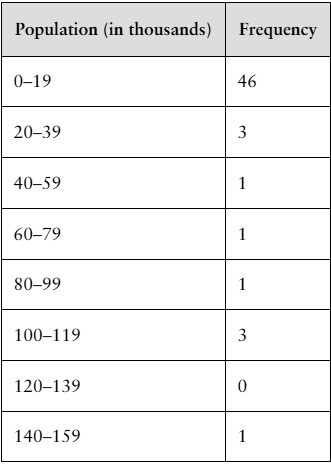
Populations The populations (in thousands) of the counties in Montana in 2019 (Source: U.S. Census Bureau)
Problem 2.3.66a
Extending Concepts
Trimmed Mean To find the 10% trimmed mean of a data set, order the data, delete the lowest 10% of the entries and the highest 10% of the entries, and find the mean of the remaining entries.
a. Find the 10% trimmed mean for the data in Exercise 65.
Problem 2.3.66b
Extending Concepts
Trimmed Mean To find the 10% trimmed mean of a data set, order the data, delete the lowest 10% of the entries and the highest 10% of the entries, and find the mean of the remaining entries.
b. Compare the four measures of central tendency, including the midrange.
Problem 2.3.66c
Extending Concepts
Trimmed Mean To find the 10% trimmed mean of a data set, order the data, delete the lowest 10% of the entries and the highest 10% of the entries, and find the mean of the remaining entries.
c. What is the benefit of using a trimmed mean versus using a mean found using all data entries? Explain your reasoning.
Problem 2.3.55
Identifying the Shape of a Distribution In Exercises 53–56, construct a frequency distribution and a frequency histogram for the data set using the indicated number of classes. Describe the shape of the histogram as symmetric, uniform, negatively skewed, positively skewed, or none of these.
Heights of Males
Number of classes: 5
Data set: The heights (to the nearest inch) of 30 males
67 76 69 68 72 68 65 63 75 69
66 72 67 66 69 73 64 62 71 73
68 72 71 65 69 66 74 72 68 69
Problem 2.3.39
In Exercises 37– 40, without performing any calculations, determine which measure of central tendency best represents the graphed data. Explain your reasoning.
Problem 2.3.41
Finding a Weighted Mean In Exercises 41– 46, find the weighted mean of the data.
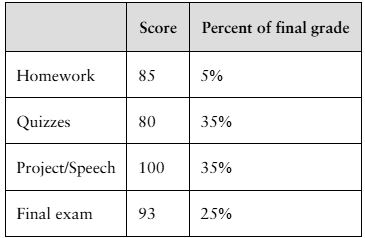
Final Grade The scores and their percents of the final grade for a statistics student are shown below. What is the student’s mean score?
Problem 2.3.44
Finding a Weighted Mean In Exercises 41– 46, find the weighted mean of the data.
Credit Card Balance For the month of October, a credit card has a balance of $115.63 for 12 days, $637.19 for 6 days, $1225.06 for 7 days, $0 for 2 days, and $34.88 for 4 days. What is the account’s mean daily balance for October?
Problem 2.3.19
Using and Interpreting Concepts
Finding and Discussing the Mean, Median, and Mode In Exercises 17–34, find the mean, the median, and the mode of the data, if possible. If any measure cannot be found or does not represent the center of the data, explain why.
Video Durations The lengths (in minutes) of seven educational videos from the Public Broadcasting Service (PBS) (Source: PBS)
83 67 90 55 56 119 52
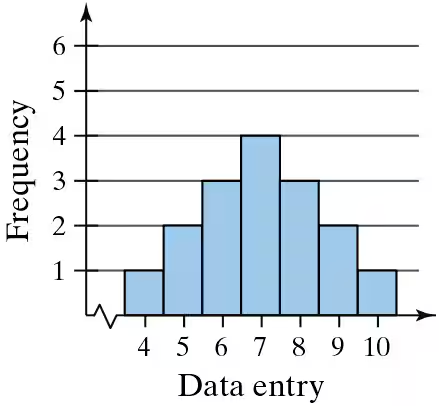
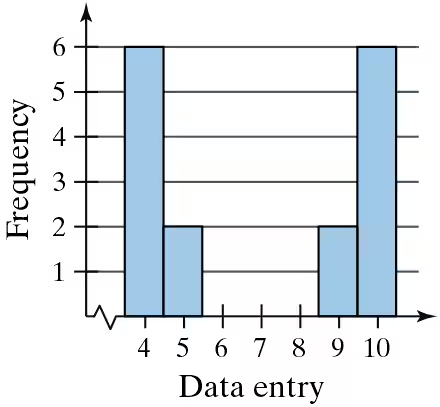
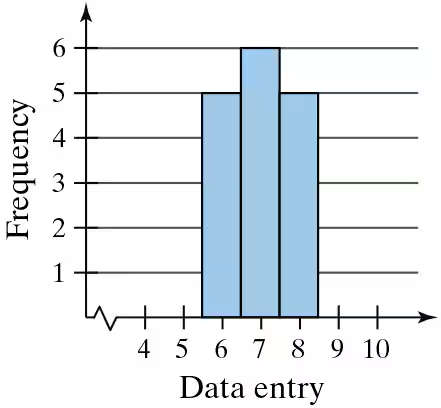
Problem 2.4.22c
Graphical Analysis In Exercises 21–24, you are asked to compare three data sets.
(c) Estimate the sample standard deviations. Then determine how close each of your estimates is by finding the sample standard deviations.
i.
ii.
iii.
Problem 2.4.1
Building Basic Skills and Vocabulary
Explain how to find the range of a data set. What is an advantage of using the range as a measure of variation? What is a disadvantage?
Problem 2.4.6
Building Basic Skills and Vocabulary
Given a data set, how do you know whether to calculate σ or s?