Here are the essential concepts you must grasp in order to answer the question correctly.
Histogram
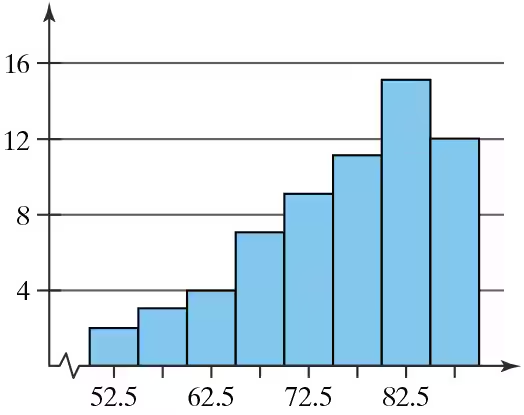
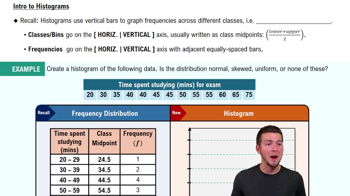
A histogram is a graphical representation of the distribution of numerical data, where the data is divided into intervals (bins) and the frequency of data points within each interval is represented by the height of bars. It helps visualize the shape of the data distribution, making it easier to identify patterns such as central tendency, variability, and skewness.
Recommended video:
Distribution Shape
The shape of a distribution refers to the way data points are spread across the range of values. Common shapes include symmetric (equal on both sides), uniform (equal frequency across intervals), skewed left (tail on the left side), and skewed right (tail on the right side). Understanding the shape is crucial for interpreting data characteristics and making statistical inferences.
Recommended video:
Skewness
Skewness measures the asymmetry of a distribution around its mean. A distribution is skewed left if it has a longer tail on the left side, indicating that most data points are concentrated on the right. Conversely, a right-skewed distribution has a longer tail on the right. Identifying skewness helps in understanding the nature of the data and can influence the choice of statistical methods for analysis.
Recommended video:
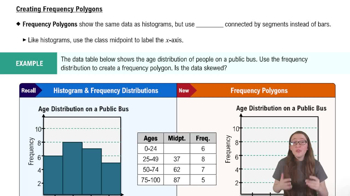
Creating Frequency Polygons