Rank Sum After ranking the combined list of female heights given in Exercise 1, find the sum of the ranks for the ANSUR I sample.
Table of contents
- 1. Intro to Stats and Collecting Data1h 14m
- 2. Describing Data with Tables and Graphs1h 56m
- 3. Describing Data Numerically2h 5m
- 4. Probability2h 16m
- 5. Binomial Distribution & Discrete Random Variables3h 6m
- 6. Normal Distribution and Continuous Random Variables2h 11m
- 7. Sampling Distributions & Confidence Intervals: Mean3h 23m
- Sampling Distribution of the Sample Mean and Central Limit Theorem19m
- Distribution of Sample Mean - Excel23m
- Introduction to Confidence Intervals15m
- Confidence Intervals for Population Mean1h 18m
- Determining the Minimum Sample Size Required12m
- Finding Probabilities and T Critical Values - Excel28m
- Confidence Intervals for Population Means - Excel25m
- 8. Sampling Distributions & Confidence Intervals: Proportion2h 10m
- 9. Hypothesis Testing for One Sample5h 8m
- Steps in Hypothesis Testing1h 6m
- Performing Hypothesis Tests: Means1h 4m
- Hypothesis Testing: Means - Excel42m
- Performing Hypothesis Tests: Proportions37m
- Hypothesis Testing: Proportions - Excel27m
- Performing Hypothesis Tests: Variance12m
- Critical Values and Rejection Regions28m
- Link Between Confidence Intervals and Hypothesis Testing12m
- Type I & Type II Errors16m
- 10. Hypothesis Testing for Two Samples5h 37m
- Two Proportions1h 13m
- Two Proportions Hypothesis Test - Excel28m
- Two Means - Unknown, Unequal Variance1h 3m
- Two Means - Unknown Variances Hypothesis Test - Excel12m
- Two Means - Unknown, Equal Variance15m
- Two Means - Unknown, Equal Variances Hypothesis Test - Excel9m
- Two Means - Known Variance12m
- Two Means - Sigma Known Hypothesis Test - Excel21m
- Two Means - Matched Pairs (Dependent Samples)42m
- Matched Pairs Hypothesis Test - Excel12m
- Two Variances and F Distribution29m
- Two Variances - Graphing Calculator16m
- 11. Correlation1h 24m
- 12. Regression3h 33m
- Linear Regression & Least Squares Method26m
- Residuals12m
- Coefficient of Determination12m
- Regression Line Equation and Coefficient of Determination - Excel8m
- Finding Residuals and Creating Residual Plots - Excel11m
- Inferences for Slope31m
- Enabling Data Analysis Toolpak1m
- Regression Readout of the Data Analysis Toolpak - Excel21m
- Prediction Intervals13m
- Prediction Intervals - Excel19m
- Multiple Regression - Excel29m
- Quadratic Regression15m
- Quadratic Regression - Excel10m
- 13. Chi-Square Tests & Goodness of Fit2h 21m
- 14. ANOVA2h 28m
9. Hypothesis Testing for One Sample
Steps in Hypothesis Testing
Problem 13.5.1
Textbook Question
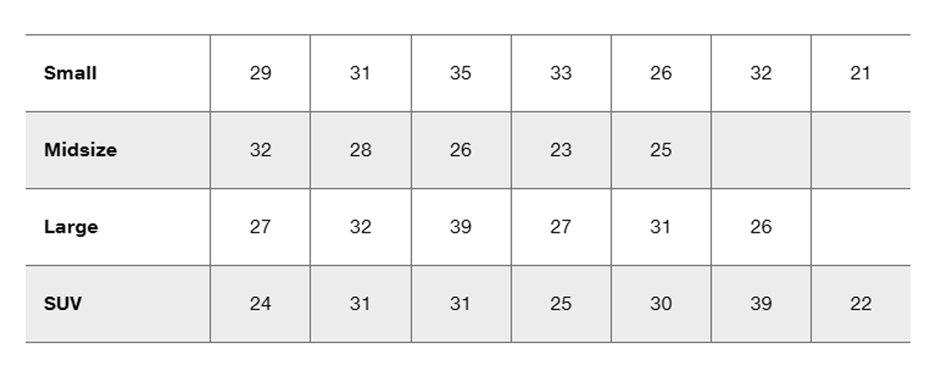
HIC Measurements Listed below are head injury criterion (HIC) measurements from crash tests of small, midsize, large, and SUV vehicles. In using the Kruskal-Wallis test, we must rank all of the data combined, and then we must find the sum of the ranks for each sample. Find the sum of the ranks for each of the four samples.

 Verified step by step guidance
1
Step 1: Combine all the HIC measurements from the four samples (Small, Midsize, Large, SUV) into a single list. This will include all the values from the table: [29, 31, 35, 33, 26, 32, 21, 32, 28, 26, 23, 25, 27, 32, 39, 27, 31, 26, 24, 31, 31, 25, 30, 39, 22].
Step 2: Rank all the combined data in ascending order. Assign ranks to the values, starting with 1 for the smallest value. If there are ties (i.e., repeated values), assign the average rank to the tied values. For example, if two values are tied at positions 3 and 4, both will receive a rank of (3+4)/2 = 3.5.
Step 3: Separate the ranked data back into their respective samples (Small, Midsize, Large, SUV). Each sample will now have ranks corresponding to its original values.
Step 4: Calculate the sum of the ranks for each sample. Add up all the ranks for the values in each sample (Small, Midsize, Large, SUV).
Step 5: Verify the calculations by ensuring the total sum of ranks across all samples equals the sum of integers from 1 to the total number of data points (n). For example, if there are 25 data points, the sum of ranks should equal n(n+1)/2 = 25(25+1)/2 = 325.
 Verified video answer for a similar problem:
This video solution was recommended by our tutors as helpful for the problem above
Video duration:
6mPlay a video:
0 Comments
Key Concepts
Here are the essential concepts you must grasp in order to answer the question correctly.
Kruskal-Wallis Test
The Kruskal-Wallis test is a non-parametric statistical method used to compare three or more independent groups. It assesses whether the samples originate from the same distribution by ranking all data points combined and analyzing the rank sums. This test is particularly useful when the assumptions of ANOVA are not met, such as when data is not normally distributed.
Recommended video:
Guided course

Step 2: Calculate Test Statistic
Ranking Data
Ranking data involves ordering the values from lowest to highest and assigning a rank to each value. In the context of the Kruskal-Wallis test, all data points from different groups are combined and ranked together, which allows for a comparison of the groups based on their ranks rather than their raw scores. This process is crucial for the test's calculations.
Recommended video:
Guided course

Visualizing Qualitative vs. Quantitative Data
Sum of Ranks
The sum of ranks is the total of the ranks assigned to the data points within each group. In the Kruskal-Wallis test, calculating the sum of ranks for each sample is essential for determining whether there are significant differences between the groups. This sum is then used in the test statistic to evaluate the null hypothesis regarding the equality of the groups.
Recommended video:
Guided course

Calculating Standard Deviation Example 1

 6:21m
6:21mWatch next
Master Step 1: Write Hypotheses with a bite sized video explanation from Patrick
Start learningRelated Videos
Related Practice
