

 05:54
05:54

Textbook Question
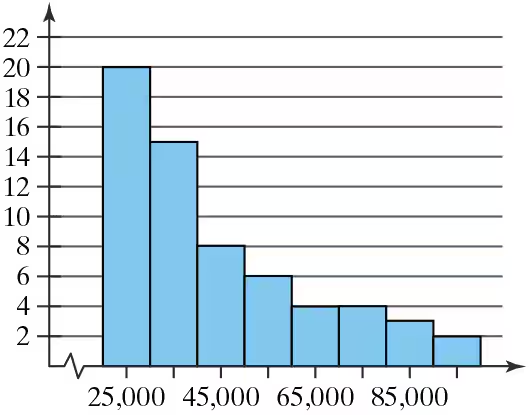
In Exercises 1–5, use the data listed in the margin, which are magnitudes (Richter scale) and depths (km) of earthquakes from Data Set 24 “Earthquakes” in Appendix B
Histogram Construct the histogram corresponding to the frequency distribution from Exercise 1. For the values on the horizontal axis, use the class midpoint values. Which of the following comes closest to describing the distribution: uniform, normal, skewed left, skewed right?