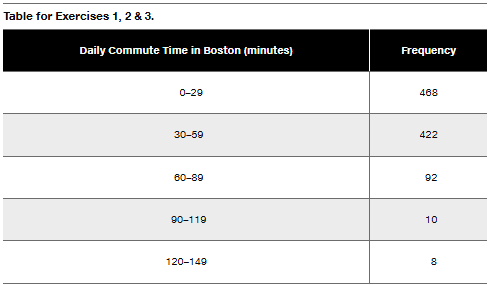
Use the frequency distribution below to find the class width and class midpoints.
Table of contents
- 1. Intro to Stats and Collecting Data1h 14m
- 2. Describing Data with Tables and Graphs1h 55m
- 3. Describing Data Numerically2h 5m
- 4. Probability2h 16m
- 5. Binomial Distribution & Discrete Random Variables3h 6m
- 6. Normal Distribution and Continuous Random Variables2h 11m
- 7. Sampling Distributions & Confidence Intervals: Mean3h 23m
- Sampling Distribution of the Sample Mean and Central Limit Theorem19m
- Distribution of Sample Mean - Excel23m
- Introduction to Confidence Intervals15m
- Confidence Intervals for Population Mean1h 18m
- Determining the Minimum Sample Size Required12m
- Finding Probabilities and T Critical Values - Excel28m
- Confidence Intervals for Population Means - Excel25m
- 8. Sampling Distributions & Confidence Intervals: Proportion1h 12m
- 9. Hypothesis Testing for One Sample3h 29m
- 10. Hypothesis Testing for Two Samples4h 50m
- Two Proportions1h 13m
- Two Proportions Hypothesis Test - Excel28m
- Two Means - Unknown, Unequal Variance1h 3m
- Two Means - Unknown Variances Hypothesis Test - Excel12m
- Two Means - Unknown, Equal Variance15m
- Two Means - Unknown, Equal Variances Hypothesis Test - Excel9m
- Two Means - Known Variance12m
- Two Means - Sigma Known Hypothesis Test - Excel21m
- Two Means - Matched Pairs (Dependent Samples)42m
- Matched Pairs Hypothesis Test - Excel12m
- 11. Correlation1h 6m
- 12. Regression1h 50m
- 13. Chi-Square Tests & Goodness of Fit1h 57m
- 14. ANOVA1h 57m
2. Describing Data with Tables and Graphs
Frequency Distributions
Problem 2.1.1
Textbook Question
Boston Commute Time The accompanying table summarizes daily commute times in Boston. How many commute times are included in the summary? Is it possible to identify the exact values of all of the original data amounts?

Verified step by step guidance1
Step 1: To determine the total number of commute times included in the summary, sum the frequencies provided in the table. The frequencies are: 488, 422, 92, 10, and 8.
Step 2: Add these frequencies together using the formula: \( \text{Total Commute Times} = \text{Frequency}_1 + \text{Frequency}_2 + \text{Frequency}_3 + \text{Frequency}_4 + \text{Frequency}_5 \).
Step 3: To address whether it is possible to identify the exact values of all original data amounts, consider the nature of the data. The table provides grouped data (intervals of commute times) rather than individual commute times. This means the exact values of the original data cannot be determined, only the range within which they fall.
Step 4: Understand that grouped data summarizes the frequency of values within intervals, but does not retain the specific individual data points. For example, in the interval 0–29 minutes, there are 488 commute times, but their exact values are unknown.
Step 5: Conclude that while the total number of commute times can be calculated, the exact values of all original data amounts cannot be identified from the given summary table.
Verified video answer for a similar problem:This video solution was recommended by our tutors as helpful for the problem above
Video duration:
2mPlay a video:
Was this helpful?
Key Concepts
Here are the essential concepts you must grasp in order to answer the question correctly.
Frequency Distribution
A frequency distribution is a summary of how often each value occurs in a dataset. In the context of the table, it shows the number of commuters falling within specific time ranges, allowing for a clear understanding of the distribution of commute times in Boston.
Recommended video:
Guided course
Intro to Frequency Distributions
Cumulative Frequency
Cumulative frequency is the running total of frequencies through the classes in a frequency distribution. It helps in understanding how many observations fall below a particular value, which can be useful for identifying trends in commute times.
Recommended video:
Creating Frequency Polygons
Data Reconstruction
Data reconstruction refers to the process of estimating or inferring the original data values from summarized data, such as frequency distributions. In this case, while we can determine the total number of commute times, we cannot identify the exact values of all original data amounts due to the grouped nature of the data.
Recommended video:
Guided course
Visualizing Qualitative vs. Quantitative Data
Watch next
Master Intro to Frequency Distributions with a bite sized video explanation from Patrick
Start learningRelated Videos
Related Practice
Multiple Choice
