

 04:39
04:39

Textbook Question
Graphing Data Sets In Exercises 17–32, organize the data using the indicated type of graph. Describe any patterns.
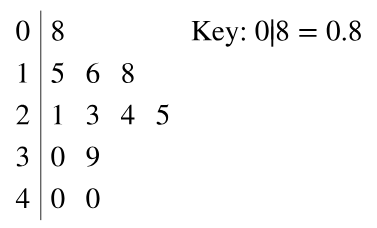
Nursing Use a stem-and-leaf plot to display the data, which represent the number of hours 24 nurses work per week.
40 40 35 48 38 40 36 50 32 36 40 35
30 24 40 36 40 36 40 39 33 40 32 38