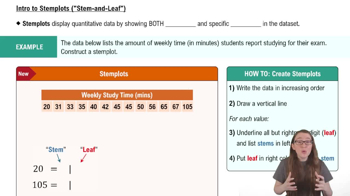
The overall averages of 12 students in a statistics class prior to taking the final exam are listed.
67 72 88 73 99 85 81 87 63 94 68 87
d. Display the data in a stem-and-leaf plot. Use one line per stem.
 Verified step by step guidance
 Verified video answer for a similar problem:

