The overall averages of 12 students in a statistics class prior to taking the final exam are listed. 67 72 88 73 99 85 81 87 63 94 68 87
d. Display the data in a stem-and-leaf plot. Use one line per stem.
Verified step by step guidance
1
Step 1: Understand the stem-and-leaf plot. A stem-and-leaf plot is a way to organize numerical data by separating each value into a 'stem' (all but the last digit) and a 'leaf' (the last digit). For example, the number 67 would have a stem of 6 and a leaf of 7.
Step 2: Identify the range of the data. The smallest value is 63, and the largest value is 99. This means the stems will range from 6 to 9 (representing the tens place).
Step 3: Create the stems. Write down the stems (6, 7, 8, and 9) in a vertical column, each on its own line. These represent the tens place of the numbers.
Step 4: Assign the leaves to their respective stems. For each number in the data set, write the last digit (the leaf) next to the corresponding stem. For example, for the number 67, write the leaf 7 next to the stem 6. Repeat this for all numbers in the data set.
Step 5: Organize the leaves in ascending order for each stem. Once all the leaves are assigned, sort them in increasing order for each stem to make the plot easier to read. For example, if the leaves for stem 6 are 7, 3, and 8, rearrange them as 3, 7, 8.
Verified video answer for a similar problem:
This video solution was recommended by our tutors as helpful for the problem above
Video duration:
2m
Play a video:
0 Comments
Key Concepts
Here are the essential concepts you must grasp in order to answer the question correctly.
Stem-and-Leaf Plot
A stem-and-leaf plot is a method of displaying quantitative data in a graphical format, similar to a histogram, that helps visualize the distribution of the data. Each number is split into a 'stem' (the leading digit or digits) and a 'leaf' (the trailing digit). This format retains the original data values while providing a clear view of the data's shape and distribution.
Organizing data is crucial for effective analysis and interpretation. In the context of a stem-and-leaf plot, data must be sorted in ascending order to accurately represent the distribution. This organization allows for easier identification of patterns, such as clusters or gaps in the data, which can inform further statistical analysis.
Descriptive statistics summarize and describe the main features of a dataset. Key measures include the mean, median, mode, and range, which provide insights into the central tendency and variability of the data. Understanding these concepts is essential for interpreting the results displayed in a stem-and-leaf plot and for making informed conclusions about the dataset.

 Verified step by step guidance
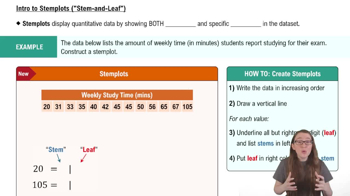
 06:23
06:23
