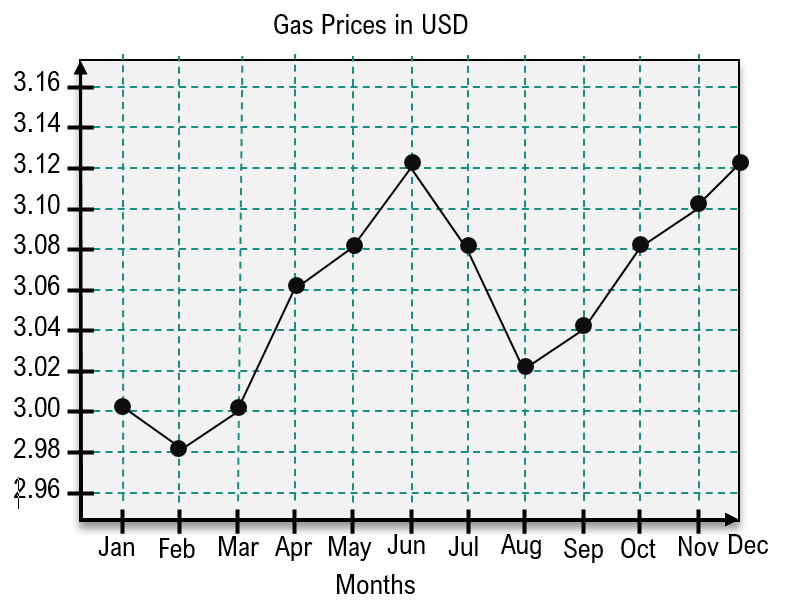
Graphing Data Sets In Exercises 17–32, organize the data using the indicated type of graph. Describe any patterns.
Engineering Degrees Use a time series chart to display the data shown in the table. The data represent the number of bachelor’s degrees in engineering (in thousands) conferred in the U.S. (Source: U.S. Deapartment of Education)


