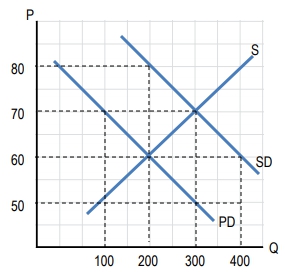
Join thousands of students who trust us to help them ace their exams!Watch the first video
Multiple Choice
Based on the figure above, an unregulated market would produce:
A
100 units
B
200 units
C
300 units
D
400 units
Verified step by step guidance
1
Identify the supply and demand curves on the graph. The supply curve is labeled 'S' and the demand curve is labeled 'SD'.
Locate the equilibrium point where the supply and demand curves intersect. This point represents the equilibrium price and quantity in an unregulated market.
Observe the quantity at the equilibrium point on the horizontal axis (Q-axis). This is the quantity that would be produced in an unregulated market.
Check the options provided in the problem (100 units, 200 units, 300 units, 400 units) and compare them with the equilibrium quantity identified on the graph.
Select the option that matches the equilibrium quantity from the graph as the correct answer for the quantity produced in an unregulated market.
Master Public Solutions to Externalities:Command-and-Control Policies and Corrective Pigovian Taxes and Subsidies with a bite sized video explanation from Brian