Understanding the concept of elasticity along a linear demand curve is crucial for analyzing consumer behavior and revenue generation. While slope and elasticity are related, they are fundamentally different. The slope measures the ratio of changes between two variables in specific units, whereas elasticity measures the ratio of percentage changes, highlighting the significance of percentage differences in economic analysis.
For instance, consider a price increase from \$1 to \$2. The unit change is \$1, but the percentage change is 100%, as the price doubled. Conversely, increasing the price from \$2 to \$3 results in a unit change of \$1, but only a 50% increase, illustrating how larger initial values lead to smaller percentage changes. This distinction is vital when analyzing demand curves, as it affects how we interpret consumer responsiveness to price changes.
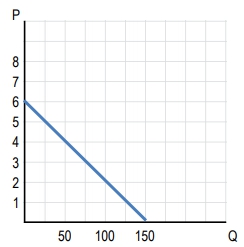
On a linear demand curve, different sections exhibit varying elasticities. To the left of the midpoint, demand is elastic, meaning that percentage changes in quantity demanded are greater than percentage changes in price. To the right of the midpoint, demand becomes inelastic, where percentage changes in price exceed those in quantity demanded. The midpoint itself represents unit elasticity, where total revenue is maximized.
Total revenue (TR) is calculated using the formula: TR = Price × Quantity. As price decreases and quantity demanded increases, total revenue initially rises until it reaches the unit elastic point, after which further price decreases lead to a decline in total revenue. This behavior can be visualized in a graph where total revenue is plotted against quantity, showing an increase up to the unit elastic point and a subsequent decrease.
In summary, when analyzing a linear demand curve, remember that demand is elastic to the left of the midpoint, unit elastic at the midpoint, and inelastic to the right. This understanding is essential for making informed decisions regarding pricing strategies and maximizing revenue.