Understanding the relationships between marginal cost, average fixed cost, average variable cost, and average total cost is crucial in microeconomics. These concepts are often represented graphically, showcasing how they interact as production levels change.
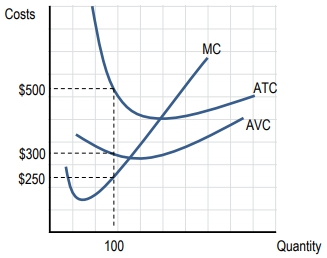
The marginal cost (MC) curve, typically depicted in black, illustrates the cost of producing one additional unit. It is characterized by a steep increase at higher production levels, reflecting the law of diminishing returns, where each additional unit becomes more expensive to produce. This curve intersects the average variable cost (AVC) and average total cost (ATC) curves at their minimum points, indicating the production level at which these averages are minimized.
The average fixed cost (AFC) curve, shown in blue, consistently declines as output increases. This occurs because fixed costs are spread over a larger number of units, leading to a lower average fixed cost per unit. The shape of the AFC curve is distinct, as it continuously decreases without rising.
The average variable cost (AVC) and average total cost (ATC) curves are typically U-shaped, reflecting initial decreases in costs due to efficiencies gained from increased production, followed by increases as production becomes less efficient. The ATC curve is always above the AVC curve because it includes both fixed and variable costs. The vertical distance between these two curves represents the average fixed cost, which diminishes as output increases.
Mathematically, the relationship between these costs can be expressed as:
\[ \text{ATC} = \text{AFC} + \text{AVC} \]
This equation can be rearranged to find average fixed cost:
\[ \text{AFC} = \text{ATC} - \text{AVC} \]
As production increases, the gap between the ATC and AVC curves narrows, indicating that fixed costs contribute less to the total cost per unit. This highlights that, at higher output levels, variable costs dominate total costs.
In summary, the interplay between these cost curves is essential for understanding production efficiency and cost management. The marginal cost curve's position relative to the average cost curves determines whether average costs are rising or falling, providing valuable insights for decision-making in production and pricing strategies.