Back
BackProblem 3
Randomization with Commute Times Given the two samples of commute times (minutes) shown here, which of the following are randomizations of them?
[Image]
a. Boston: 10 10 60. New York: 5 20 25 30 45.
b. Boston: 10 10 60 20 25. New York: 5 30 45.
c. Boston: 5 10 25 25 60. New York: 5 30 30 60.
d. Boston: 10 10 60. New York: 5 20 25 30 45.
e. Boston: 10 10 10 10 10. New York: 60 60 60.
Problem 6.R.6b
Smoking Cessation Programs
b. Does the difference between the success rate of the sustained care program and the standard care program appear to have practical significance?
Problem 8
Color and Recall Researchers from the University of British Columbia conducted trials to investigate the effects of color on the accuracy of recall. Subjects were given tasks consisting of words displayed on a computer screen with background colors of red and blue. The subjects studied 36 words for 2 minutes, and then they were asked to recall as many of the words as they could after waiting 20 minutes. Results from scores on the word recall test are given below. Use a 0.05 significance level to test the claim that variation of scores is the same with the red background and blue background.
[Image]
Problem 8.1.18a
Finding Critical Values
In Exercises 17–20, refer to the information in the given exercise and use a 0.05 significance level for the following.
a. Find the critical value(s).
b. Should we reject H0 or should we fail to reject H0?
Exercise 14
Problem 9.5.6
In Exercises 5–8, use (a) randomization and (b) bootstrapping for the indicated exercise from Section 9-1. Compare the results to those obtained in the original exercise.
Exercise 8 in Section 9-1 “Tennis Challenges”
Problem 9.4.4
Robust What does it mean when we say that the F test described in this section is not robust against departures from normality?
Problem 9.2.27
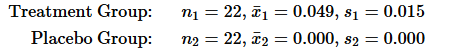
No Variation in a Sample An experiment was conducted to test the effects of alcohol. Researchers measured the breath alcohol levels for a treatment group of people who drank ethanol and another group given a placebo. The results are given below (based on data from “Effects of Alcohol Intoxication on Risk Taking, Strategy, and Error Rate in Visuomotor Performance,” by Streufert et al., Journal of Applied Psychology, Vol. 77, No. 4). Use a 0.05 significance level to test the claim that the two sample groups come from populations with the same mean.
Problem 9
Testing Effects of Alcohol Researchers conducted an experiment to test the effects of alcohol. Errors were recorded in a test of visual and motor skills for a treatment group of 22 people who drank ethanol and another group of 22 people given a placebo. The errors for the treatment group have a standard deviation of 2.20, and the errors for the placebo group have a standard deviation of 0.72 (based on data from “Effects of Alcohol Intoxication on Risk Taking, Strategy, and Error Rate in Visuomotor Performance,” by Streufert et al., Journal of Applied Psychology, Vol. 77, No. 4). Use a 0.05 significance level to test the claim that both groups have the same amount of variation among the errors.
Problem 9.2.4
Degrees of Freedom For Example 1, we used df=smaller of n1-1 and n2-1 we got df=11 and the corresponding critical value is t=-1.796 (found from Table A-4). If we calculate df using Formula 9-1, we get df=19.370 and the corresponding critical value is t=-1.727 How is using the critical value of t=-1.796 “more conservative” than using the critical value of t=-1.727
Problem 9.3.18
In Exercises 17–24, use the indicated Data Sets from Appendix B. The complete data sets can be found at www.TriolaStats.com. Assume that the paired sample data are simple random samples and the differences have a distribution that is approximately normal.
Measured and Reported Weights Repeat Example 1 using all of the 2784 measured and reported weights of males listed in Data Set 4 “Measured and Reported” in Appendix B. Did the larger data set have much of an effect on the results?
Problem 9.7
Body Temperatures Listed below are body temperatures from six different subjects measured at two different times in a day (from Data Set 5 “Body Temperatures” in Appendix B).
a. Are the two sets of data independent or dependent? Explain.
[Image]
Problem 9.5.4
Randomization vs t Test Two samples of commute times from Boston and New York are randomly selected and it is found that the samples sizes are n1 = 18 and n2 = 12 and each of the two samples appears to be from a population with a distribution that is dramatically far from normal. Which method is more likely to yield better results for testing Mu1 is not equals to Mu2. Hypothesis test using the t distribution (as in Section 9-2) or the resampling method?
Problem 9.5.1
Bootstrapping and Randomization When resampling data from two independent samples, what is the fundamental difference between bootstrapping and randomization?
Problem 9.5.5
In Exercises 5–8, use (a) randomization and (b) bootstrapping for the indicated exercise from Section 9-1. Compare the results to those obtained in the original exercise.
Exercise 7 in Section 9-1 “Buttered Toast Drop”
Problem 9.5.2
Sampling Methods A student obtains a sample of responses to the question “Do you plan to take or have you taken a statistics course?” A second student obtains a sample of responses to the same question. The first student surveys only males at the same college, and the second student surveys only females at the same college. What is wrong with the samples? Can randomization be used to overcome the flaws of those samples?
Problem 9.2.26
Degrees of Freedom In Exercise 20 “Blanking Out on Tests,” using the “smaller of n1-1 and n2-1” for the number of degrees of freedom results in df=15 Find the number of degrees of freedom using Formula 9-1. In general, how are hypothesis tests and confidence intervals affected by using Formula 9-1 instead of the “smaller of n1-1 and n2-1 ”?
Problem 9.1.26
Equivalence of Hypothesis Test and Confidence Interval Two different simple random samples are drawn from two different populations. The first sample consists of 20 people with 10 having a common attribute. The second sample consists of 2000 people with 1404 of them having the same common attribute. Compare the results from a hypothesis test of p1=p2 (with a 0.05 significance level) and a 95% confidence interval estimate of p1-p2
Problem 9.5.7
In Exercises 5–8, use (a) randomization and (b) bootstrapping for the indicated exercise from Section 9-1. Compare the results to those obtained in the original exercise.
Exercise 9 in Section 9-1 “Cell Phones and Handedness”
Problem 9.3.1
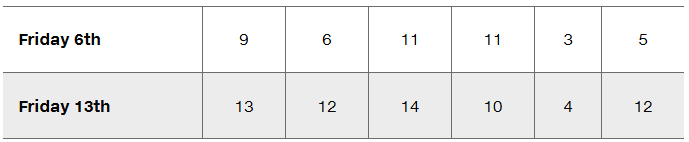
Is Friday the 13th Unlucky? Listed below are numbers of hospital admissions in one region due to traffic accidents on different Fridays falling on the 6th day of a month and the following 13th day of the month (based on data from “Is Friday the 13th Bad for Your Health,” by Scanlon et al., British Medical Journal, Vol. 307). Assume that we want to use a 0.05 significance level to test the claim that the data support the claim that fewer hospital admissions due to traffic accidents occur on Friday the 6th than on the following Friday the 13th. Identify the null hypothesis and alternative hypothesis.
Problem 9.4.7
Color and Creativity Researchers from the University of British Columbia conducted trials to investigate the effects of color on creativity. Subjects with a red background were asked to think of creative uses for a brick; other subjects with a blue background were given the same task. Responses were scored by a panel of judges and results from scores of creativity are given below. Use a 0.05 significance level to test the claim that creative task scores have the same variation with a red background and a blue background.
[Image]
Problem 9.4.3
Test for Normality For the hypothesis test described in Exercise 2, the sample sizes are n1 = 2208 and n2 = 1986 When using the F test with these data, is it correct to reason that there is no need to check for normality because both samples have sizes that are greater than 30?
Problem 9.CR.4
In Exercises 1–10, based on the nature of the given data, do the following:
a. Pose a key question that is relevant to the given data.
b. Identify a procedure or tool from this chapter or the preceding chapters to address the key question from part (a).
c. Analyze the data and state a conclusion.
IQ Scores of Twins Listed below are IQ scores of twins listed in Data Set 12 “IQ and Brain Size” in Appendix B. The data are pairs of IQ scores from ten different families.
Problem 9.CR.3
In Exercises 1–10, based on the nature of the given data, do the following:
a. Pose a key question that is relevant to the given data.
b. Identify a procedure or tool from this chapter or the preceding chapters to address the key question from part (a).
c. Analyze the data and state a conclusion.
Video Games In a survey of subjects aged 18–29, subjects were asked if they play video games often or sometimes. Among 1017 males, 72% answered “yes.” Among 984 females, 49% answered “yes” (based on data from a Pew Research Center survey).
Problem 9.CR.2
In Exercises 1–10, based on the nature of the given data, do the following:
a. Pose a key question that is relevant to the given data.
b. Identify a procedure or tool from this chapter or the preceding chapters to address the key question from part (a).
c. Analyze the data and state a conclusion.
Video Games In a survey of subjects aged 18–29, subjects were asked if they play video games often or sometimes. Among 984 females, 49% answered “yes” (based on data from a Pew Research Center survey).
Problem 9.Q.6
Variation Find the value of the test statistic used for testing the claim that the two samples from Exercise 5 are from populations having the same variation.
Problem 9.QQ.2
Test Values p_cap1, p_cap2. Find the values of and the pooled proportion p_bar obtained when testing the claim given in Exercise 1.
Problem 9.QQ.1
Identifying Hypotheses In a randomized clinical trial of adults with an acute sore throat, 288 were treated with the drug dexamethasone and 102 of them experienced complete resolution; 277 were treated with a placebo and 75 of them experienced complete resolution (based on data from “Effect of Oral Dexamethasone Without Immediate Antibiotics vs Placebo on Acute Sore Throat in Adults,” by Hayward et al., Journal of the American Medical Association). Identify the null and alternative hypotheses corresponding to the claim that patients treated with dexamethasone and patients given a placebo have the same rate of complete resolution.
Problem 9.QQ.7b
Body Temperatures Listed below are body temperatures from six different subjects measured at two different times in a day (from Data Set 5 “Body Temperatures” in Appendix B).
b. Identify the null and alternative hypotheses for using the sample data to test the claim that the differences between 8 AM temperatures and 12 AM temperatures are from a population with a mean equal to 0°F
Problem 9.R.6a
Smoking Cessation Programs
a. Construct the confidence interval that could be used to test the claim in Exercise 5. What feature of the confidence interval leads to the same conclusion from Exercise 5?
Problem 9.R.3
Forecast and Actual Temperatures Listed below are actual temperatures (°F) along with the temperatures that were forecast five days earlier (data collected by the author). Use a 0.05 significance level to test the claim that differences between actual temperatures and temperatures forecast five days earlier are from a population with a mean of 0°F.