Here are the essential concepts you must grasp in order to answer the question correctly.
Hypothesis Testing
Hypothesis testing is a statistical method used to make decisions about a population based on sample data. It involves formulating a null hypothesis (H0) and an alternative hypothesis (H1). In this context, the null hypothesis states that the mean difference between actual and forecast temperatures is 0°F, while the alternative suggests it is not. The process includes calculating a test statistic and comparing it to a critical value to determine if the null hypothesis can be rejected.
Recommended video:
Significance Level
The significance level, denoted as alpha (α), is the threshold for determining whether to reject the null hypothesis. A common significance level is 0.05, which indicates a 5% risk of concluding that a difference exists when there is none. In this scenario, using a 0.05 significance level means that if the p-value obtained from the test is less than 0.05, the null hypothesis can be rejected, suggesting that the differences in temperatures are statistically significant.
Recommended video:
Step 4: State Conclusion Example 4
Mean Difference
The mean difference refers to the average of the differences between paired observations—in this case, the actual temperatures and the forecasted temperatures. Calculating the mean difference helps to assess whether the forecast is accurate. If the mean difference is significantly different from 0°F, it indicates that the forecasts are systematically off, which is the primary claim being tested in this analysis.
Recommended video:
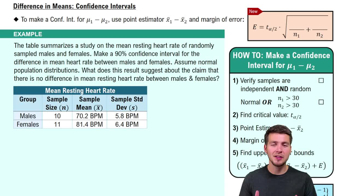
Difference in Means: Confidence Intervals