Here are the essential concepts you must grasp in order to answer the question correctly.
Hypothesis Testing
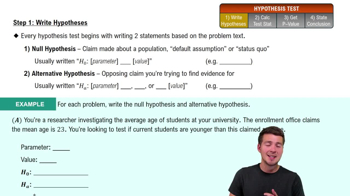
Hypothesis testing is a statistical method used to make inferences about a population based on sample data. It involves formulating a null hypothesis (H0) and an alternative hypothesis (H1), then using sample data to determine whether to reject H0. In this case, the null hypothesis would state that the percentage of voters who believe they voted for the winning candidate is 43%, while the alternative would suggest it is not.
Recommended video:
Significance Level
The significance level, often denoted as alpha (α), is the threshold for determining whether a result is statistically significant. A common significance level is 0.05, which indicates a 5% risk of concluding that a difference exists when there is none. In this scenario, if the p-value from the hypothesis test is less than 0.05, it would suggest that the observed voter perception significantly differs from the claimed percentage.
Recommended video:
Step 4: State Conclusion Example 4
P-Value
The p-value is a statistical measure that helps determine the strength of the evidence against the null hypothesis. It represents the probability of observing the sample data, or something more extreme, if the null hypothesis is true. A low p-value (typically less than the significance level) indicates strong evidence against the null hypothesis, suggesting that the actual voter perception may differ from the claimed 43%.
Recommended video: