Here are the essential concepts you must grasp in order to answer the question correctly.
Descriptive Statistics
Descriptive statistics involve summarizing and organizing data to describe its main features. Common measures include mean, median, mode, and standard deviation, which provide insights into the central tendency and variability of the data. In the context of lightning deaths, these statistics help understand the average number of deaths and the spread of data over the years.
Recommended video:
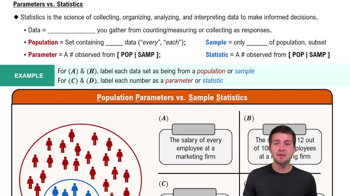
Parameters vs. Statistics
Data Visualization
Data visualization is the graphical representation of data, which helps in identifying patterns, trends, and outliers that may not be evident from raw data or summary statistics alone. Tools like histograms, box plots, or scatter plots can reveal the distribution and any anomalies in lightning death data, offering a clearer picture of its behavior over time.
Recommended video:
Visualizing Qualitative vs. Quantitative Data
Outliers
Outliers are data points that differ significantly from other observations, potentially indicating variability or errors in data collection. Identifying outliers is crucial as they can skew results and affect statistical analyses. In the lightning deaths data, examining outliers can help understand unusual years with exceptionally high or low death counts, which may not be apparent from basic statistics.
Recommended video:
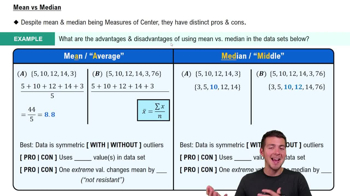
Comparing Mean vs. Median