Back
BackProblem 7.1.27
Stating the Null and Alternative Hypotheses In Exercises 25–30, write the claim as a mathematical statement. State the null and alternative hypotheses, and identify which represents the claim.
Base Price of an ATV The standard deviation of the base price of an all-terrain vehicle is no more than $320.
Problem 7.5.29
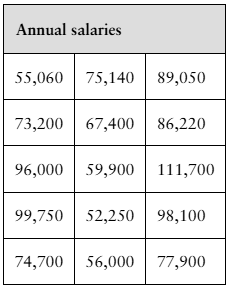
Hypothesis Testing Using Rejection Regions In Exercises 23–30, (a) identify the claim and state H0 and Ha, (b) find the critical value(s) and identify the rejection region(s), (c) find the standardized test statistic X^2, (d) decide whether to reject or fail to reject the null hypothesis, and (e) interpret the decision in the context of the original claim. Assume the population is normally distributed.
Salaries The annual salaries (in dollars) of 15 randomly chosen senior level graphic design specialists are shown in the table at the left. At α=0.05, is there enough evidence to support the claim that the standard deviation of the annual salaries is different from $13,056?
Problem 7.2.44
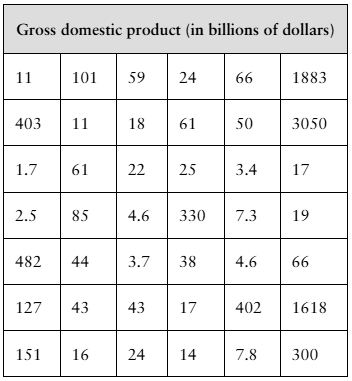
Hypothesis Testing Using Rejection Region(s) In Exercises 39–44, (a) identify the claim and state H0 and Ha, (b) find the critical value(s) and identify the rejection region(s), (c) find the standardized test statistic z, (d) decide whether to reject or fail to reject the null hypothesis, and (e) interpret the decision in the context of the original claim.
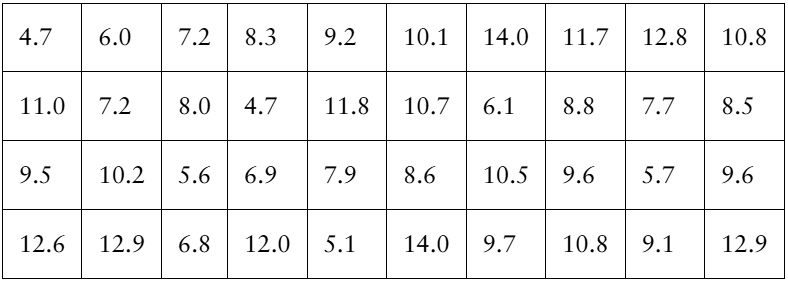
[APPLET] Gross Domestic Product A politician estimates that the mean gross domestic product (GDP) per country in a recent year is greater than $400 billion. You want to test this estimate. To do so, you determine the GDPs of 42 randomly selected countries for that year. The results (in billions of dollars) are shown in the table at the left. Assume the population standard deviation is $2099 billion. At alpha=0.06, can you support the politician’s estimate?
Problem 7.2.31
In Exercises 29–32, test the claim about the population mean at the level of significance α. Assume the population is normally distributed.
Claim: ; μ ≠ 5880; α = 0.03; α = 413
Sample statistics: x_bar = 5771, n = 67
Problem 7.2.21
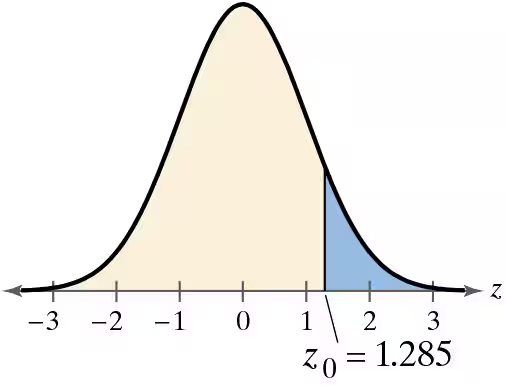
Graphical Analysis In Exercises 21 and 22, state whether each standardized test statistic z allows you to reject the null hypothesis. Explain your reasoning.
a. z = -1.301
b. z = 1.203
c. z = 1.280
d. z = 1.286
Problem 7.4.4
In Exercises 3–6, determine whether a normal sampling distribution can be used. If it can be used, test the claim.
Claim: p ≥0.48, α=0.08. Sample statistics: p_hat = 0.40, n=90
Problem 7.3.2
Explain how to use a t-test to test a hypothesized mean mu when sigma is unknown. What assumptions are necessary?
Problem 7.5.6
Explain how to test a population variance or a population standard deviation.
Problem 7.3.32
Deciding on a Distribution In Exercises 31 and 32, decide whether you should use the standard normal sampling distribution or a t-sampling distribution to perform the hypothesis test. Justify your decision. Then use the distribution to test the claim. Write a short paragraph about the results of the test and what you can conclude about the claim.
Tuition and Fees An education publication claims that the mean in-state tuition and fees at public four-year institutions by state is more than $10,500 per year. A random sample of 30 states has a mean in-state tuition and fees at public four-year institutions of $10,931 per year. Assume the population standard deviation is $2380. At α=0.01, test the publication’s claim.
Problem 7.2.12
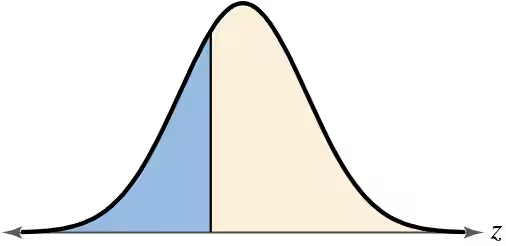
Graphical Analysis In Exercises 9–12, match the P-value or z-statistic with the graph that represents the corresponding area. Explain your reasoning.
z = -0.51
Problem 7.2.46
Writing In a right-tailed test where P < alpha, does the standardized test statistic lie to the left or the right of the critical value? Explain your reasoning.
Problem 7.1.42
Identifying the Nature of a Hypothesis Test In Exercises 37–42, state and in words and in symbols. Then determine whether the hypothesis test is left-tailed, right-tailed, or two-tailed. Explain your reasoning. Sketch a normal sampling distribution and shade the area for the P-value.
High School Graduation Rate A high school claims that its mean graduation rate is more than 97%.
Problem 7.3.21
Hypothesis Testing Using Rejection Regions In Exercises 19–26, (a) identify the claim and state H0 and Ha, (b) find the critical value(s) and identify the rejection region(s), (c) find the standardized test statistic t, (d) decide whether to reject or fail to reject the null hypothesis, and (e) interpret the decision in the context of the original claim. Assume the population is normally distributed.
Credit Card Debt A credit reporting agency claims that the mean credit card debt in Colorado is greater than $5540 per borrower. You want to test this claim. You find that a random sample of 30 borrowers has a mean credit card debt of $5594 per person and a standard deviation of $597 per person. At , can you support the claim α=0.05?
Problem 7.4.16
Hypothesis Testing Using a P-Value In Exercises 13–16, (a) identify the claim and state H0 and Ha, (b) use technology to find the P-value, (c) decide whether to reject or fail to reject the null hypothesis, and (d) interpret the decision in the context of the original claim.
Stray Cats An animal advocate claims that 25% of U.S. households have taken in a stray cat. In a random sample of 500 U.S. households, 105 say they have taken in a stray cat. At α=0.05, is there enough evidence to reject the advocate’s claim?
Problem 7.1.20
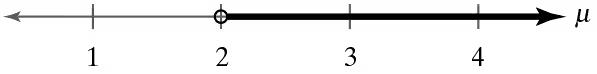
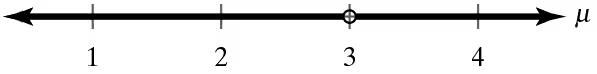
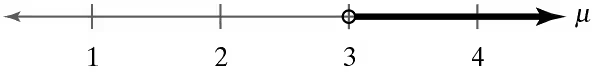
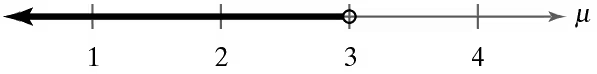
Graphical Analysis In Exercises 17–20, match the alternative hypothesis with its graph. Then state the null hypothesis and sketch its graph.
Ha: μ > 3
a.
b.
c.
d.
Problem 7.1.54
Getting at the Concept Explain why a level of significance of α=0 is not used.
Problem 7.1.8
True or False? In Exercises 5–10, determine whether the statement is true or false. If it is false, rewrite it as a true statement.
The level of significance is the maximum probability you allow for rejecting a null hypothesis when it is actually true.
Problem 7.31
In Exercises 29 –34, find the critical value(s) and rejection region(s) for the type of t-test with level of significance α and sample size n.
Right-tailed test, α=0.02, n=63
Problem 7.Q.1
A hat company claims that the mean hat size for a male is at least 7.25. A random sample of 12 hat sizes has a mean of 7.15. At α=0.01, can you reject the company’s claim? Assume the population is normally distributed and the population standard deviation is 0.27.
Problem 7.Q.3
A government agency reports that the mean amount of earnings for full-time workers ages 18 to 24 with a bachelor’s degree in a recent year is $52,133. In a random sample of 15 full-time workers ages 18 to 24 with a bachelor’s degree, the mean amount of earnings is $48,400 and the standard deviation is $6679. At α=0.05, is there enough evidence to reject the claim? Assume the population is normally distributed.
Problem 7.Q.5
A nonprofit consumer organization says that less than 25% of the televisions the organization rated in a recent year have an overall score of 70 or more. In a random sample of 35 televisions the organization rated in a recent year, 23% have an overall score of 70 or more. At α=0.05, can you support the organization’s claim?
Problem 7.Q.2
A travel analyst claims the mean daily base price for renting a full-size or less expensive vehicle in Vancouver, British Columbia, is more than $86. You want to test this claim. In a random sample of 40 full-size or less expensive vehicles available to rent in Vancouver, British Columbia, the mean daily base price is $93.23. Assume the population standard deviation is $28.90. At α=0.10, do you have enough evidence to support the analyst’s claim?
Problem 7.Q.4
[APPLET] A weight loss program claims that program participants have a mean weight loss of at least 10.5 pounds after 1 month. The weight losses after 1 month (in pounds) of a random sample of 40 program participants are listed below. At α=0.01, is there enough evidence to reject the program’s claim?
Problem 7.R.4
n Exercises 1–6, the statement represents a claim. Write its complement and state which is H0 and which is Ha.
μ ≠ 150,020
Problem 7.R.6
n Exercises 1–6, the statement represents a claim. Write its complement and state which is H0 and which is Ha.
p ≥ 0.64
Problem 7.R.2
n Exercises 1–6, the statement represents a claim. Write its complement and state which is H0 and which is Ha.
μ = 82
Problem 7.RE.27
In Exercises 27 and 28, (a) identify the claim and state H0 and Ha, (b) find the critical value(s) and identify the rejection region(s), (c) find the standardized test statistic z, (d) decide whether to reject or fail to reject the null hypothesis, and (e) interpret the decision in the context of the original claim.
A substance abuse counselor claims that the mean annual drug overdose death rate for the 50 states is at least 25 deaths per 100,000 people. In a random sample of 30 states, the mean annual drug overdose rate is 22.48 per 100,000 people. Assume the population standard deviation is 10.69 deaths per 100,000. At α=0.01, is there enough evidence to reject the claim?
Problem 7.RE.9e
In Exercises 7–10, explain how you should interpret a decision that fails to reject the null hypothesis.
A nonprofit consumer organization says that the standard deviation of the starting prices of its top-rated vehicles for a recent year is no more than $2900.
Problem 7.RE.11
In Exercises 11 and 12, find the P-value for the hypothesis test with the standardized test statistic z. Decide whether to reject H0 for the level of significance α.
Left-tailed test, z = -0.94, α = 0.05
Problem 7.RE.29
In Exercises 29 –34, find the critical value(s) and rejection region(s) for the type of t-test with level of significance α and sample size n.
Two-tailed test, α=0.05, n=20