Back
BackProblem 7.1.15
Stating Hypotheses In Exercises 11–16, the statement represents a claim. Write its complement and state which is H0 and which is Ha.
p < 0.45
Problem 7.3.1
Explain how to find critical values for a t-distribution.
Problem 7.1.36
Identifying Type I and Type II Errors In Exercises 31–36, describe type I and type II errors for a hypothesis test of the indicated claim.
Phone Repairs A cell phone repair shop advertises that the mean cost of repairing a phone screen is less than $120.
Problem 7.5.20
In Exercises 15–22, test the claim about the population variance or standard deviation at the level of significance Assume the population is normally distributed.
Claim: σ^2>19, α=0.1. Sample statistics: s^2=28, n=17
Problem 7.5.11
In Exercises 7–12, find the critical value(s) and rejection region(s) for the type of chi-square test with sample size n and level of significance α.
Two-tailed test, n=81,α=0.10
Problem 7.2.12
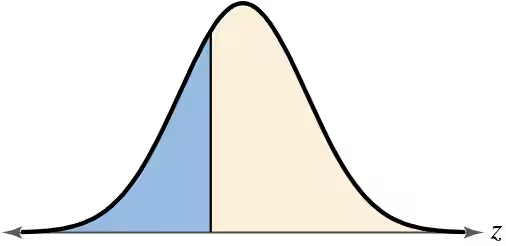
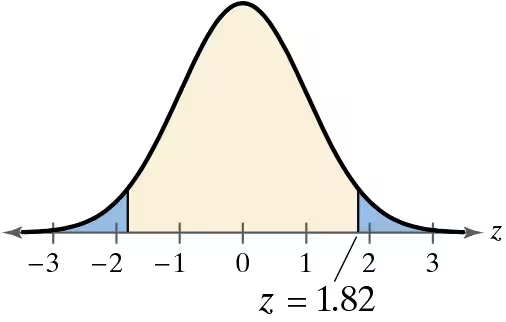
Graphical Analysis In Exercises 9–12, match the P-value or z-statistic with the graph that represents the corresponding area. Explain your reasoning.
z = -0.51
Problem 7.2
In Exercise 1, you rejected the claim that p=0.53. But this claim was true. What type of error is this?
Problem 7.4.5
In Exercises 3–8, find the critical value(s) and rejection region(s) for the type of t-test with level of significance alpha and sample size n.
Right-tailed test, α=0.05, n=23
Problem 7.2.7
Interpreting a P-Value In Exercises 3–8, the P-value for a hypothesis test is shown. Use the P-value to decide whether to reject H0 when the level of significance is (a)α=0.01, (b) α=0.05 , and (c) α=0.10.
P = 0.0838
Problem 7.5.7
In Exercises 7–12, find the critical value(s) and rejection region(s) for the type of chi-square test with sample size n and level of significance α.
Right-tailed test, n=27,α=0.05
Problem 7.5.2
Can a critical value for the chi-square test be negative? Explain.
Problem 7.3.4
In Exercises 3–8, find the critical value(s) and rejection region(s) for the type of t-test with level of significance alpha and sample size n.
Left-tailed test, α=0.01, n=35
Problem 7.5.5
How do the requirements for a chi-square test for a variance or standard deviation differ from a z-test or a t-test for a mean?
Problem 7.1.41
Identifying the Nature of a Hypothesis Test In Exercises 37–42, state and in words and in symbols. Then determine whether the hypothesis test is left-tailed, right-tailed, or two-tailed. Explain your reasoning. Sketch a normal sampling distribution and shade the area for the P-value.
Survey A polling organization reports that the number of responses to a survey mailed to 100,000 U.S. residents is not 100,000.
Problem 7.1.5
True or False? In Exercises 5–10, determine whether the statement is true or false. If it is false, rewrite it as a true statement.
In a hypothesis test, you assume the alternative hypothesis is true.
Problem 7.4.2
Explain how to test a population proportion p.
Problem 7.1.9
True or False? In Exercises 5–10, determine whether the statement is true or false. If it is false, rewrite it as a true statement.
A large P-value in a test will favor rejection of the null hypothesis.
Problem 7.2.28
Finding Critical Values and Rejection Regions In Exercises 23–28, find the critical value(s) and rejection region(s) for the type of z-test with level of significance α. Include a graph with your answer.
Two-tailed test, α = 0.12
Problem 7.4.7
In Exercises 3–8, find the critical value(s) and rejection region(s) for the type of t-test with level of significance alpha and sample size n.
Two-tailed test, α=0.05, n=27
Problem 7.1.16
Stating Hypotheses In Exercises 11–16, the statement represents a claim. Write its complement and state which is H0 and which is Ha.
p = 0.21
Problem 7.1.20
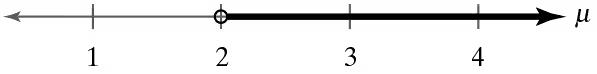
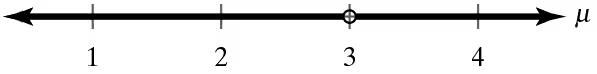
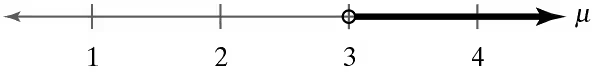
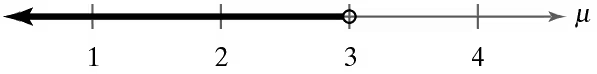
Graphical Analysis In Exercises 17–20, match the alternative hypothesis with its graph. Then state the null hypothesis and sketch its graph.
Ha: μ > 3
a.
b.
c.
d.
Problem 7.4.8
Hypothesis Testing Using Rejection Regions In Exercises 7–12, (a) identify the claim and state H0 and Ha, (b) find the critical value(s) and identify the rejection region(s), (c) find the standardized test statistic z, (d) decide whether to reject or fail to reject the null hypothesis, and (e) interpret the decision in the context of the original claim.
Vaccinations In 2021, a reporter claims that at least 55% of U.S. adults feel that COVID-19 vaccinations should be required for high school students to attend school in the fall. In a random sample of 200 U.S. adults, 56% feel that COVID-19 vaccinations should be required for high school students to attend school in the fall. At α=0.10, is there enough evidence to reject the reporter’s claim?
Problem 7.2.10
Graphical Analysis In Exercises 9–12, match the P-value or z-statistic with the graph that represents the corresponding area. Explain your reasoning.
P= 0.2802
Problem 7.3.18
In Exercises 13–18, test the claim about the population mean μ at the level of significance α. Assume the population is normally distributed.
Claim: μ≠52,200; α=0.05. Sample statistics: x_bar=53,220, s=2700, n=34
Problem 7.3.26
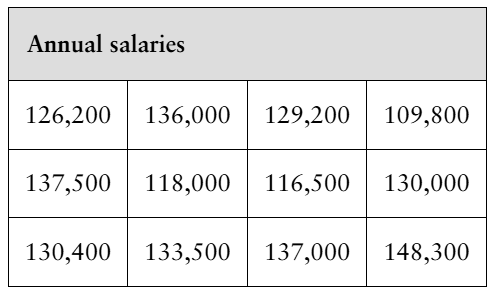
Hypothesis Testing Using Rejection Regions In Exercises 19–26, (a) identify the claim and state H0 and Ha, (b) find the critical value(s) and identify the rejection region(s), (c) find the standardized test statistic t, (d) decide whether to reject or fail to reject the null hypothesis, and (e) interpret the decision in the context of the original claim. Assume the population is normally distributed.
Annual Salary An employment information service claims the mean annual salary for senior level statisticians is more than $124,000. The annual salaries (in dollars) for a random sample of 12 senior level statisticians are shown in the table at the left. At α=0.01, is there enough evidence to support the claim that the mean salary is more than $124,000?
Problem 7.2.33
Hypothesis Testing Using a P-Value In Exercises 33–38,
a. identify the claim and state and .
b. find the standardized test statistic z.
c. find the corresponding P-value.
d. decide whether to reject or fail to reject the null hypothesis.
e. interpret the decision in the context of the original claim.
MCAT Scores A random sample of 100 medical school applicants at a university has a mean total score of 505 on the MCAT. According to a report, the mean total score for the school’s applicants is more than 503. Assume the population standard deviation is 10.6. At alpha=0.01, is there enough evidence to support the report’s claim?
Problem 7.1.39
Identifying the Nature of a Hypothesis Test In Exercises 37–42, state and in words and in symbols. Then determine whether the hypothesis test is left-tailed, right-tailed, or two-tailed. Explain your reasoning. Sketch a normal sampling distribution and shade the area for the P-value.
Golf A golf analyst claims that the standard deviation of the 18-hole scores for a golfer is less than 2.1 strokes.
Problem 7.4.16
Hypothesis Testing Using a P-Value In Exercises 13–16, (a) identify the claim and state H0 and Ha, (b) use technology to find the P-value, (c) decide whether to reject or fail to reject the null hypothesis, and (d) interpret the decision in the context of the original claim.
Stray Cats An animal advocate claims that 25% of U.S. households have taken in a stray cat. In a random sample of 500 U.S. households, 105 say they have taken in a stray cat. At α=0.05, is there enough evidence to reject the advocate’s claim?
Problem 7.1.11
Stating Hypotheses In Exercises 11–16, the statement represents a claim. Write its complement and state which is H0 and which is Ha.
μ ≤ 645
Problem 7.2.2
The mean of a random sample of 18 test scores is x_bar. The standard deviation of the population of all test scores is sigma= 6. Under what condition can you use a z-test to decide whether to reject a claim that the population mean is mu=88?