Back
BackProblem 6.4.11
In Exercises 9–12, construct the indicated confidence intervals for (a) the population variance and (b) the population standard deviation . Assume the sample is from a normally distributed population.
c = 0.90, s^2 = 35, n = 18
Problem 6.1.55
When estimating the population mean, why not construct a 99% confidence interval every time?
Problem 6.2.33
In Exercise 31, the population mean salary is $67,319. Does the t-value fall between -t0.98 and t0.98? (Source: Salary.com)
Problem 6.1.26
In Exercises 25–28, use the confidence interval to find the margin of error and the sample mean.
(21.61, 30.15)
Problem 6.3.16
Bisexual Idenfitication In a survey of 692 lesbian, gay, bisexual, or transgender U.S adults, 378 said that they consider themselves bisexual. Construct a 90% confidence interval for the population proportion of lesbian, gay, bisexual, or transgender U.S. adults who consider themselves bisexual. (Adapted from Gallup)
Problem 6.1.48
Determining a Minimum Sample Size Determine the minimum sample size required when you want to be 99% confident that the sample mean is within two units of the population mean and σ = 1.4. Assume the population is normally distributed.
Problem 6.3.15
LGBT Identification In a survey of 15,349 U.S. adults, 860 identify as lesbian, gay, bisexual, or transgender. Construct a 95% confidence interval for the population proportion of U.S. adults who identify as lesbian, gay, bisexual, or transgender. (Adapted from Gallup)
Problem 6.3.5
Finding p^ and q^ In Exercises 3 – 6, let p be the population proportion for the situation. Find point estimates of p and q.
Social Security In a survey of 661 non-retired Americans, 218 said that they expect to rely on Social Security as major source of income when they retire. (Adapted from Gallup)
Problem 6.4.7
Finding Critical Values for χ2 In Exercises 3–8, find the critical values χR2 and χL2 for the level of confidence c and sample size n.
c = 0.99, n = 30
Problem 6.3.33
Translating Statements In Exercises 29–34, translate the statement into a confidence interval. Approximate the level of confidence.
In a survey of 2094 U.S. adults who have used an online dating app, 57% said their personal experience with online dating was positive. The survey’s margin of error is ±3.6%. (Source: Pew Research Center)
Problem 6.3.1
True or False? In Exercises 1 and 2, determine whether the statement is true or false. If it is false, rewrite it as a true statement.
The point estimate for the population proportion of failures is 1-p^
Problem 6.4.2
What happens to the shape of the chi-square distribution as the degrees of freedom increase?
Problem 6.4.9
In Exercises 9–12, construct the indicated confidence intervals for (a) the population variance and (b) the population standard deviation . Assume the sample is from a normally distributed population.
c = 0.95, s^2 = 11.56, n = 30
Problem 6.1.20
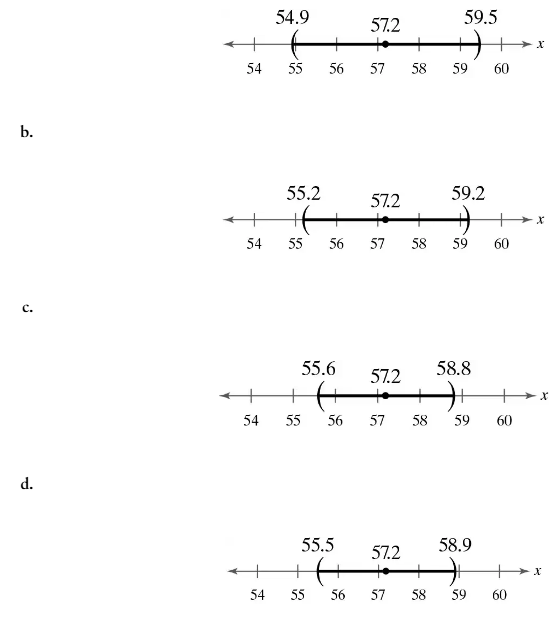
Matching In Exercises 17–20, match the level of confidence c with the appropriate confidence interval. Assume each confidence interval is constructed for the same sample statistics.
c = 0.98
Problem 6.2.41
Tennis Ball Manufacturing A company manufactures tennis balls. When the balls are dropped onto a concrete surface from a height of 100 inches, the company wants the mean bounce height to be 55.5 inches. This average is maintained by periodically testing random samples of 25 tennis balls. If the t-value falls between and , then the company will be satisfied that it is manufacturing acceptable tennis balls. For a random sample, the mean bounce height of the sample is 56.0 inches and the standard deviation is 0.25 inch. Assume the bounce heights are approximately normally distributed. Is the company making acceptable tennis balls? Explain.
Problem 6.3.34
Translating Statements In Exercises 29–34, translate the statement into a confidence interval. Approximate the level of confidence.
In a survey of 1052 parents of children ages 8–14, 68% say they are willing to get a second or part-time job to pay for their children’s college education, and 42% say they lose sleep worrying about college costs. The survey’s margin of error is ±3%. (Source: T. Rowe Price Group, Inc.)
Problem 6.2.31
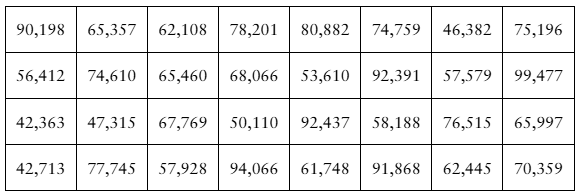
Constructing a Confidence Interval In Exercises 31 and 32, use the data set to (c) construct a 98% confidence interval for the population mean.
[APPLET] Earnings The annual earnings (in dollars) of 32 randomly selected intermediate level life insurance underwriters (Adapted from Salary.com)
Problem 6.1.16
In Exercises 13–16, find the margin of error for the values of c, σ and n.
c = 0.975, σ = 4.6, n = 100
Problem 6.1.9
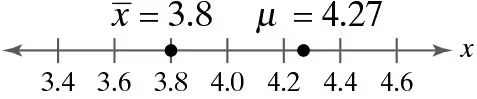
Graphical Analysis In Exercises 9–12, use the values on the number line to find the sampling error.
Problem 6.3.9
In Exercises 7–10, use the confidence interval to find the margin of error and the sample proportion.
(0.512, 0.596)
Problem 6.1.31
In Exercises 29–32, determine the minimum sample size n needed to estimate for the values of c, σ, and E.
c = 0.80, σ = 4.1, E = 2.
Problem 6.4.6
Finding Critical Values for χ2 In Exercises 3–8, find the critical values χR2 and χL2 for the level of confidence c and sample size n.
c = 0.98, n = 26
Problem 6.1.34
Finding the Margin of Error In Exercises 33 and 34, use the confidence interval to find the estimated margin of error. Then find the sample mean. Book Prices A store manager reports a confidence interval of (244.07, 280.97) when estimating the mean price (in dollars) for the population of textbooks.
Problem 6.3.4
"Finding p^ and q^ In Exercises 3 – 6, let p be the population proportion for the situation. Find point estimates of p and q.
Social Security In a survey of 351 retired Americans, 200 said that they rely on Social Security as major source of income. (Adapted from Gallup)"
Problem 6.1.10
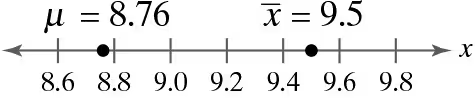
Graphical Analysis In Exercises 9–12, use the values on the number line to find the sampling error.
Problem 6.4.10
In Exercises 9–12, construct the indicated confidence intervals for (a) the population variance and (b) the population standard deviation . Assume the sample is from a normally distributed population.
c = 0.99, s^2 = 0.64, n = 7
Problem 6.1.2
Which statistic is the best unbiased estimator for μ?
a. s
b. xbar
c. the median
d. the mode
Problem 6.1.39
In Exercise 35, would it be unusual for the population mean to be over $1500? Explain.
Problem 6.1.3
For the same sample statistics, which level of confidence would produce the widest confidence interval? Explain your reasoning.
a. 90%
b. 95%
c. 98%
d. 99%
Problem 6.3.29
Translating Statements In Exercises 29–34, translate the statement into a confidence interval. Approximate the level of confidence.
In a survey of 1502 U.S. adults, 31% said that they use Pinterest. The survey’s margin of error is ±2.9%. (Source: Pew Research Center)