Back
BackProblem 7.1.23
Identifying a Test In Exercises 21–24, determine whether the hypothesis test is left-tailed, right-tailed, or two-tailed.
Ha: σ^2 = 142
H0: σ ≠ 142
Problem 7.2.24
Finding Critical Values and Rejection Regions In Exercises 23–28, find the critical value(s) and rejection region(s) for the type of z-test with level of significance α. Include a graph with your answer.
Left-tailed test, α = 0.09
Problem 7.2.43
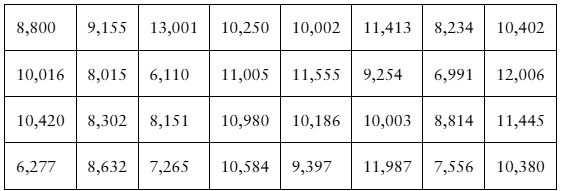
Hypothesis Testing Using Rejection Region(s) In Exercises 39–44, (a) identify the claim and state H0 and Ha, (b) find the critical value(s) and identify the rejection region(s), (c) find the standardized test statistic z, (d) decide whether to reject or fail to reject the null hypothesis, and (e) interpret the decision in the context of the original claim.
[APPLET] Fluorescent Lamps A compact fluorescent lamp (CFL) bulb manufacturer guarantees that the mean life of a CFL bulb is at least 10,000 hours. You want to test this guarantee. To do so, you record the lives of a random sample of 32 CFL bulbs. The results (in hours) are listed. Assume the population standard deviation is 1850 hours. At alpha=0.11, do you have enough evidence to reject the manufacturer’s claim?
Problem 7.1.33
Identifying Type I and Type II Errors In Exercises 31–36, describe type I and type II errors for a hypothesis test of the indicated claim.
Chess A local chess club claims that the length of time to play a game has a standard deviation of more than 12 minutes.
Problem 7.5.4
Describe the difference between calculating the standardized test statistic, Z^2, for a chi-square test for variance and a chi-square test for standard deviation.
Problem 7.1.49
Writing Hypotheses: Medicine A medical research team is investigating the mean cost of a 30-day supply of a heart medication. A pharmaceutical company thinks that the mean cost is less than $60. You want to support this claim. How would you write the null and alternative hypotheses?
Problem 7.1.60
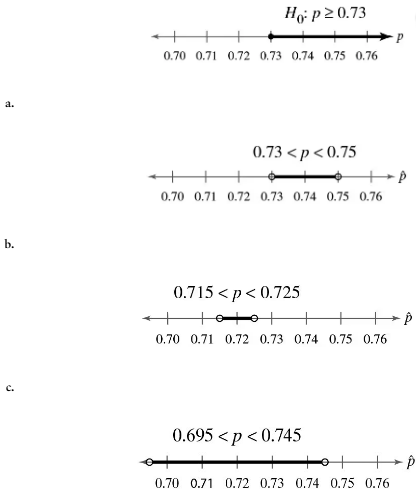
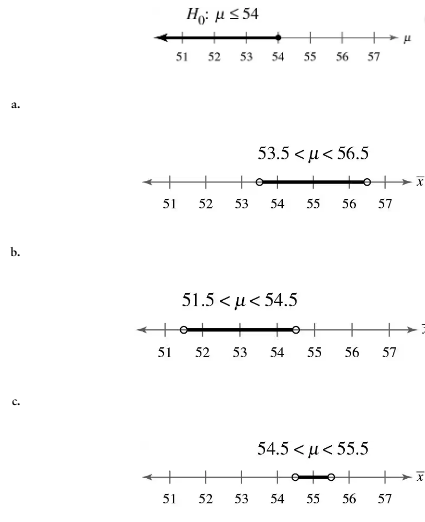
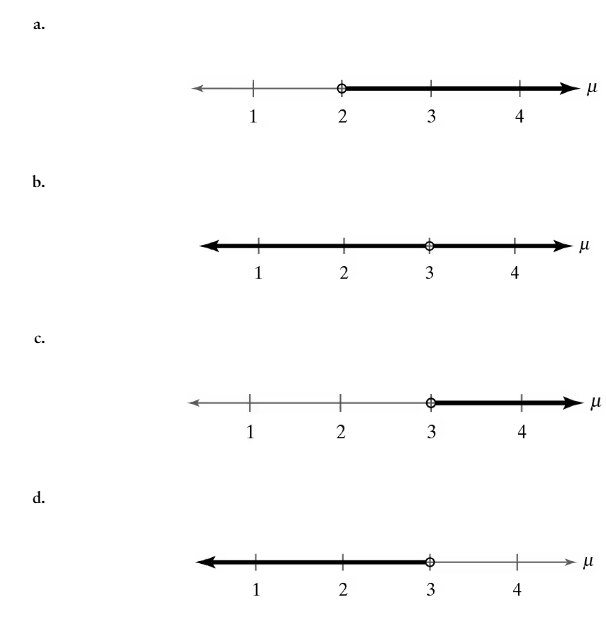
Graphical Analysis In Exercises 57–60, you are given a null hypothesis and three confidence intervals that represent three samplings. Determine whether each confidence interval indicates that you should reject H0. Explain your reasoning.
Problem 7.3.17
In Exercises 13–18, test the claim about the population mean μ at the level of significance α. Assume the population is normally distributed.
Claim: μ=4915; α=0.01. Sample statistics: x_bar=5017, s=5613, n=51
Problem 7.2.21
Graphical Analysis In Exercises 21 and 22, state whether each standardized test statistic z allows you to reject the null hypothesis. Explain your reasoning.
a. z = -1.301
b. z = 1.203
c. z = 1.280
d. z = 1.286
Problem 7.1.11
Stating Hypotheses In Exercises 11–16, the statement represents a claim. Write its complement and state which is H0 and which is Ha.
μ ≤ 645
Problem 7.5.2
Can a critical value for the chi-square test be negative? Explain.
Problem 7.1.58
Graphical Analysis In Exercises 57–60, you are given a null hypothesis and three confidence intervals that represent three samplings. Determine whether each confidence interval indicates that you should reject H0. Explain your reasoning.
Problem 7.5.30
Hypothesis Testing Using Rejection Regions In Exercises 23–30, (a) identify the claim and state H0 and Ha, (b) find the critical value(s) and identify the rejection region(s), (c) find the standardized test statistic X^2, (d) decide whether to reject or fail to reject the null hypothesis, and (e) interpret the decision in the context of the original claim. Assume the population is normally distributed.
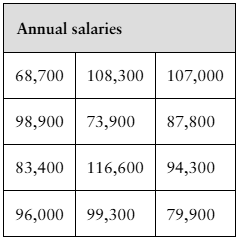
Salaries The annual salaries (in dollars) of 12 randomly chosen nursing supervisors are shown in the table at the left. At α=0.10, is there enough evidence to reject the claim that the standard deviation of the annual salaries is $18,630?
Problem 7.4.17
use the figure at the left, which suggests what adults think about protecting the environment.
[Image]
Are People Concerned About Protecting the Environment? You interview a random sample of 100 adults. The results of the survey show that 58% of the adults said they live in ways that help protect the environment some of the time. At α=0.05, can you reject the claim that at least 64% of adults make an effort to live in ways that help protect the environment some of the time?
Problem 7.4.2
Explain how to test a population proportion p.
Problem 7.3.8
In Exercises 3–8, find the critical value(s) and rejection region(s) for the type of t-test with level of significance alpha and sample size n.
Left-tailed test, α=0.10, n=38
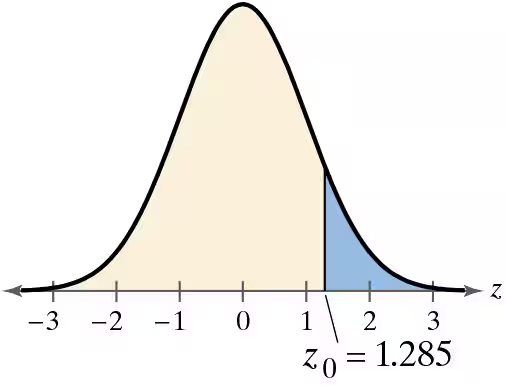
Problem 7.2.10
Graphical Analysis In Exercises 9–12, match the P-value or z-statistic with the graph that represents the corresponding area. Explain your reasoning.
P= 0.2802
Problem 7.1.9
True or False? In Exercises 5–10, determine whether the statement is true or false. If it is false, rewrite it as a true statement.
A large P-value in a test will favor rejection of the null hypothesis.
Problem 7.2.26
Finding Critical Values and Rejection Regions In Exercises 23–28, find the critical value(s) and rejection region(s) for the type of z-test with level of significance α. Include a graph with your answer.
Right-tailed test, α = 0.08
Problem 7.2.17
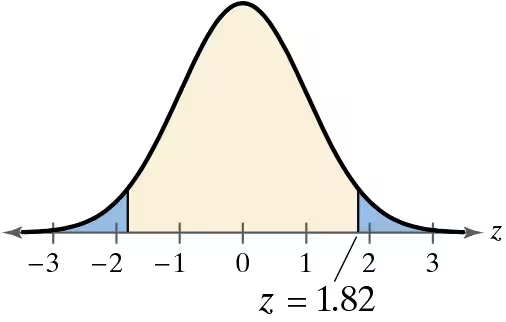
Finding a P-Value In Exercises 13–18, find the P-value for the hypothesis test with the standardized test statistic z. Decide whether to reject H0 for the level of significance alpha.
Left-tailed test
z=-1.68
alpha=0.05
Problem 7.3.3
In Exercises 3–8, find the critical value(s) and rejection region(s) for the type of t-test with level of significance alpha and sample size n.
Left-tailed test, α=0.10, n=20
Problem 7.3.32
Deciding on a Distribution In Exercises 31 and 32, decide whether you should use the standard normal sampling distribution or a t-sampling distribution to perform the hypothesis test. Justify your decision. Then use the distribution to test the claim. Write a short paragraph about the results of the test and what you can conclude about the claim.
Tuition and Fees An education publication claims that the mean in-state tuition and fees at public four-year institutions by state is more than $10,500 per year. A random sample of 30 states has a mean in-state tuition and fees at public four-year institutions of $10,931 per year. Assume the population standard deviation is $2380. At α=0.01, test the publication’s claim.
Problem 7.1.36
Identifying Type I and Type II Errors In Exercises 31–36, describe type I and type II errors for a hypothesis test of the indicated claim.
Phone Repairs A cell phone repair shop advertises that the mean cost of repairing a phone screen is less than $120.
Problem 7.5.20
In Exercises 15–22, test the claim about the population variance or standard deviation at the level of significance Assume the population is normally distributed.
Claim: σ^2>19, α=0.1. Sample statistics: s^2=28, n=17
Problem 7.4.5
In Exercises 3–8, find the critical value(s) and rejection region(s) for the type of t-test with level of significance alpha and sample size n.
Right-tailed test, α=0.05, n=23
Problem 7.1.34
Identifying Type I and Type II Errors In Exercises 31–36, describe type I and type II errors for a hypothesis test of the indicated claim.
Video Game Systems A researcher claims that the percentage of U.S. gamers that are women is not 50%.
Problem 7.2.42
Hypothesis Testing Using Rejection Region(s) In Exercises 39–44, (a) identify the claim and state H0 and Ha, (b) find the critical value(s) and identify the rejection region(s), (c) find the standardized test statistic z, (d) decide whether to reject or fail to reject the null hypothesis, and (e) interpret the decision in the context of the original claim.
Light Bulbs A light bulb manufacturer guarantees that the mean life of a certain type of light bulb is at least 750 hours. A random sample of 25 light bulbs has a mean life of 745 hours. Assume the population is normally distributed and the population standard deviation is 60 hours. At alpha= 0.02, do you have enough evidence to reject the manufacturer’s claim?
Problem 7.4.7
In Exercises 3–8, find the critical value(s) and rejection region(s) for the type of t-test with level of significance alpha and sample size n.
Two-tailed test, α=0.05, n=27
Problem 7.1.5
True or False? In Exercises 5–10, determine whether the statement is true or false. If it is false, rewrite it as a true statement.
In a hypothesis test, you assume the alternative hypothesis is true.
Problem 7.1.18
Graphical Analysis In Exercises 17–20, match the alternative hypothesis with its graph. Then state the null hypothesis and sketch its graph.
Ha: μ < 3