Back
BackProblem 7.RE.10b
In Exercises 7–10, describe type I and type II errors for a hypothesis test of the claim.
An energy bar maker claims that the mean number of grams of carbohydrates in one bar is less than 25.
Problem 7.RE.9e
In Exercises 7–10, explain how you should interpret a decision that fails to reject the null hypothesis.
A nonprofit consumer organization says that the standard deviation of the starting prices of its top-rated vehicles for a recent year is no more than $2900.
Problem 7.RE.11
In Exercises 11 and 12, find the P-value for the hypothesis test with the standardized test statistic z. Decide whether to reject H0 for the level of significance α.
Left-tailed test, z = -0.94, α = 0.05
Problem 7.RE.29
In Exercises 29 –34, find the critical value(s) and rejection region(s) for the type of t-test with level of significance α and sample size n.
Two-tailed test, α=0.05, n=20
Problem 7.RE.34
In Exercises 29 –34, find the critical value(s) and rejection region(s) for the type of t-test with level of significance α and sample size n.
Two-tailed test, α=0.02, n=12
Problem 7.RE.10c
In Exercises 7–10, (c) explain whether the hypothesis test is left-tailed, right-tailed, or two-tailed.
An energy bar maker claims that the mean number of grams of carbohydrates in one bar is less than 25.
Problem 7.RE.9d
In Exercises 7–10, explain how you should interpret a decision that rejects the null hypothesis.
A nonprofit consumer organization says that the standard deviation of the starting prices of its top-rated vehicles for a recent year is no more than $2900.
Problem 7.RE.13
In Exercises 13 –16, find the critical value(s) and rejection region(s) for the type of z-test with level of significance . Include a graph with your answer.
Left-tailed test, α=0.02
Problem 7.RE.10a
In Exercises 7–10, state the null and alternative hypotheses and identify which represents the claim,
An energy bar maker claims that the mean number of grams of carbohydrates in one bar is less than 25.
Problem 7.RE.12
In Exercises 11 and 12, find the P-value for the hypothesis test with the standardized test statistic z. Decide whether to reject H0 for the level of significance α.
Two-tailed test, z = 2.57, α = 0.10
Problem 7.RE.3
n Exercises 1–6, the statement represents a claim. Write its complement and state which is H0 and which is Ha.
p < 0.205
Problem 7.RE.48
In Exercises 45–48, determine whether a normal sampling distribution can be used to approximate the binomial distribution. If it can, test the claim.
Claim: p≥0.04; α=0.10
Sample statistics: p_hat = 0.03, n=30
Problem 7.RE.16
In Exercises 13 –16, find the critical value(s) and rejection region(s) for the type of z-test with level of significance . Include a graph with your answer.
Two-tailed test, α=0.03
Problem 7.RE.33
In Exercises 29 –34, find the critical value(s) and rejection region(s) for the type of t-test with level of significance α and sample size n.
Left-tailed test, α=0.05, n=15
Problem 7.RE.32
In Exercises 29 –34, find the critical value(s) and rejection region(s) for the type of t-test with level of significance α and sample size n.
Left-tailed test, α=0.05, n=48
Problem 7.RE.1
n Exercises 1–6, the statement represents a claim. Write its complement and state which is H0 and which is Ha.
μ ≤ 375
Problem 7.RE.15
In Exercises 13 –16, find the critical value(s) and rejection region(s) for the type of z-test with level of significance . Include a graph with your answer.
Right-tailed test, α=0.025
Problem 7.RE.10d
In Exercises 7–10, (d) explain how you should interpret a decision that rejects the null hypothesis.
An energy bar maker claims that the mean number of grams of carbohydrates in one bar is less than 25.
Problem 7.RE.9c
In Exercises 7–10, explain whether the hypothesis test is left-tailed, right-tailed, or two-tailed. A nonprofit consumer organization says that the standard deviation of the starting prices of its top-rated vehicles for a recent year is no more than $2900.
Problem 7.RE.5
n Exercises 1–6, the statement represents a claim. Write its complement and state which is H0 and which is Ha.
σ > 1.9
Problem 7.RS.3
You want your test to support a positive claim about your college, not just fail to reject one. Should you state your claim so that the null hypothesis contains the claim or the alternate hypothesis contains the claim? Explain.
Problem 7.T.4
A research center claims that more than 80% of U.S. adults think that mothers should have paid maternity leave. In a random sample of 50 U.S. adults, 82% think that mothers should have paid maternity leave. At α=0.05, is there enough evidence to support the center’s claim?
Problem 7.T.5
A nutrition bar manufacturer claims that the standard deviation of the number of grams of carbohydrates in a bar is 1.11 grams. A random sample of 26 bars has a standard deviation of 1.19 grams. At α=0.05, is there enough evidence to reject the manufacturer’s claim? Assume the population is normally distributed.
Problem 7.T.3
A travel analyst says that the mean price of a meal for a family of 4 in a resort restaurant is at most $100. A random sample of 33 meal prices for families of 4 has a mean of $110 and a standard deviation of $19. At α=0.01, is there enough evidence to reject the analyst’s claim?
Problem 7.T.7
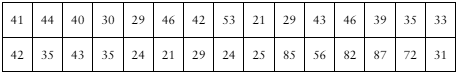
[APPLET] A researcher claims that the mean age of the residents of a small town is more than 38 years. The ages (in years) of a random sample of 30 residents are listed below. At α=0.10, is there enough evidence to support the researcher’s claim? Assume the population standard deviation is 9 years.
Problem 7.T.3
When you reject a true claim with a level of significance that is virtually zero, what can you infer about the randomness of your sampling process?
Problem 7.1.48a
Interpreting a Decision In Exercises 43–48, determine whether the claim represents the null hypothesis or the alternative hypothesis. If a hypothesis test is performed, how should you interpret a decision that
a. rejects the null hypothesis?
A recent study claims that at least 20% of renters are behind on rent payments in New Jersey.
Problem 7.3.11a
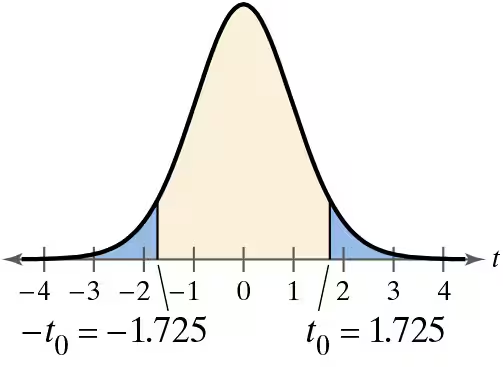
Graphical Analysis In Exercises 9–12, state whether each standardized test statistic t allows you to reject the null hypothesis. Explain.
a. t = -1.755
Problem 7.5.13a
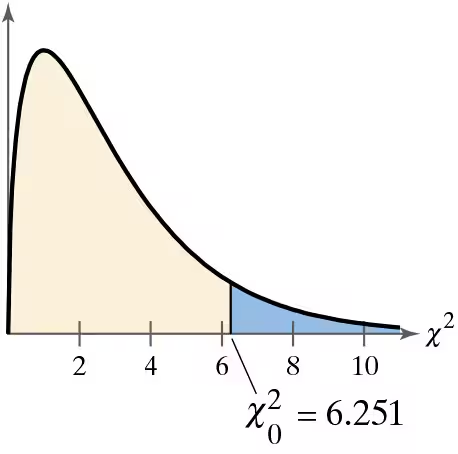
Graphical Analysis In Exercises 13 and 14, state whether each standardized test statistic X^2 allows you to reject the null hypothesis. Explain.
a. X^2=2.091
Problem 7.1.52a
Writing Hypotheses: Internet Provider An Internet provider is trying to gain advertising deals and claims that the mean time a customer spends online per day is greater than 28 minutes. You are asked to test this claim. How would you write the null and alternative hypotheses when
a. you represent the Internet provider and want to support the claim?