Back
BackProblem 7.2.44
Hypothesis Testing Using Rejection Region(s) In Exercises 39–44, (a) identify the claim and state H0 and Ha, (b) find the critical value(s) and identify the rejection region(s), (c) find the standardized test statistic z, (d) decide whether to reject or fail to reject the null hypothesis, and (e) interpret the decision in the context of the original claim.
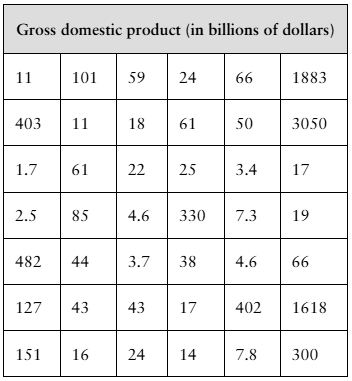
[APPLET] Gross Domestic Product A politician estimates that the mean gross domestic product (GDP) per country in a recent year is greater than $400 billion. You want to test this estimate. To do so, you determine the GDPs of 42 randomly selected countries for that year. The results (in billions of dollars) are shown in the table at the left. Assume the population standard deviation is $2099 billion. At alpha=0.06, can you support the politician’s estimate?
Problem 7.2.1
Explain the difference between the z-test for μ using a P-value and the z-test for μ using rejection region(s).
Problem 7.2.2
The mean of a random sample of 18 test scores is x_bar. The standard deviation of the population of all test scores is sigma= 6. Under what condition can you use a z-test to decide whether to reject a claim that the population mean is mu=88?
Problem 7.2.7
Interpreting a P-Value In Exercises 3–8, the P-value for a hypothesis test is shown. Use the P-value to decide whether to reject H0 when the level of significance is (a)α=0.01, (b) α=0.05 , and (c) α=0.10.
P = 0.0838
Problem 7.2.8
Interpreting a P-Value In Exercises 3–8, the P-value for a hypothesis test is shown. Use the P-value to decide whether to reject H0 when the level of significance is (a)α=0.01, (b) α=0.05 , and (c) α=0.10.
P = 0.0062
Problem 7.2
In Exercise 1, you rejected the claim that p=0.53. But this claim was true. What type of error is this?
Problem 7.3.4
In Exercises 3–8, find the critical value(s) and rejection region(s) for the type of t-test with level of significance alpha and sample size n.
Left-tailed test, α=0.01, n=35
Problem 7.3.11a
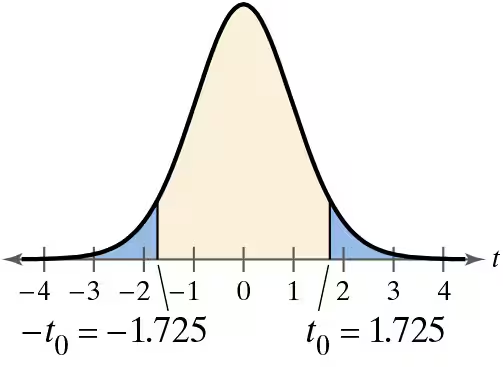
Graphical Analysis In Exercises 9–12, state whether each standardized test statistic t allows you to reject the null hypothesis. Explain.
a. t = -1.755
Problem 7.3.12c
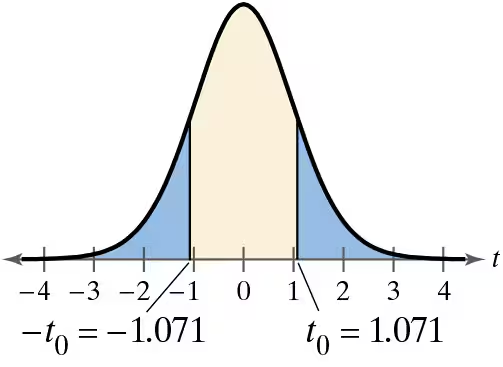
Graphical Analysis In Exercises 9–12, state whether each standardized test statistic t allows you to reject the null hypothesis. Explain.
c. t = 1.7
Problem 7.3.1
Explain how to find critical values for a t-distribution.
Problem 7.3.15
In Exercises 13–18, test the claim about the population mean μ at the level of significance α. Assume the population is normally distributed.
Claim: μ≥8000; α=0.01. Sample statistics: x_bar=77,000, s=450, n=25
Problem 7.3.17
In Exercises 13–18, test the claim about the population mean μ at the level of significance α. Assume the population is normally distributed.
Claim: μ=4915; α=0.01. Sample statistics: x_bar=5017, s=5613, n=51
Problem 7.3.18
In Exercises 13–18, test the claim about the population mean μ at the level of significance α. Assume the population is normally distributed.
Claim: μ≠52,200; α=0.05. Sample statistics: x_bar=53,220, s=2700, n=34
Problem 7.3.32
Deciding on a Distribution In Exercises 31 and 32, decide whether you should use the standard normal sampling distribution or a t-sampling distribution to perform the hypothesis test. Justify your decision. Then use the distribution to test the claim. Write a short paragraph about the results of the test and what you can conclude about the claim.
Tuition and Fees An education publication claims that the mean in-state tuition and fees at public four-year institutions by state is more than $10,500 per year. A random sample of 30 states has a mean in-state tuition and fees at public four-year institutions of $10,931 per year. Assume the population standard deviation is $2380. At α=0.01, test the publication’s claim.
Problem 7.3.29
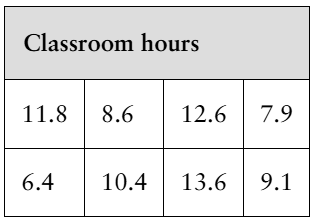
Faculty Classroom Hours The dean of a university estimates that the mean number of classroom hours per week for full-time faculty is 11.0. As a member of the student council, you want to test this claim. A random sample of the number of classroom hours for eight full-time faculty for one week is shown in the table at the left. At α=0.01, can you reject the dean’s claim?
Problem 7.3.28
Dive Duration An oceanographer claims that the mean dive duration of a North Atlantic right whale is 11.5 minutes. A random sample of 34 dive durations has a mean of 12.2 minutes and a standard deviation of 2.2 minutes. Is there enough evidence to reject the claim at α=0.10?
Problem 7.3.26
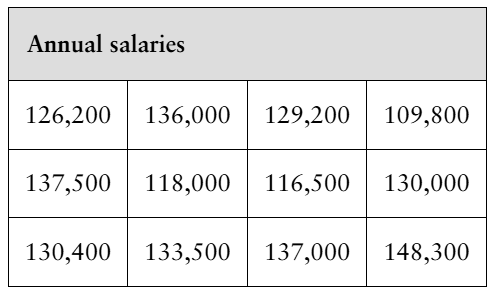
Hypothesis Testing Using Rejection Regions In Exercises 19–26, (a) identify the claim and state H0 and Ha, (b) find the critical value(s) and identify the rejection region(s), (c) find the standardized test statistic t, (d) decide whether to reject or fail to reject the null hypothesis, and (e) interpret the decision in the context of the original claim. Assume the population is normally distributed.
Annual Salary An employment information service claims the mean annual salary for senior level statisticians is more than $124,000. The annual salaries (in dollars) for a random sample of 12 senior level statisticians are shown in the table at the left. At α=0.01, is there enough evidence to support the claim that the mean salary is more than $124,000?
Problem 7.3.24
Hypothesis Testing Using Rejection Regions In Exercises 19–26, (a) identify the claim and state H0 and Ha, (b) find the critical value(s) and identify the rejection region(s), (c) find the standardized test statistic t, (d) decide whether to reject or fail to reject the null hypothesis, and (e) interpret the decision in the context of the original claim. Assume the population is normally distributed.
Lead Levels As part of your work for an environmental awareness group, you want to test a claim that the mean amount of lead in the air in U.S. cities is less than 0.032 microgram per cubic meter. You find that the mean amount of lead in the air for a random sample of 56 U.S. cities is 0.021 microgram per cubic meter and the standard deviation is 0.034 microgram per cubic meter. At α=0.01, can you support the claim?
Problem 7.3.21
Hypothesis Testing Using Rejection Regions In Exercises 19–26, (a) identify the claim and state H0 and Ha, (b) find the critical value(s) and identify the rejection region(s), (c) find the standardized test statistic t, (d) decide whether to reject or fail to reject the null hypothesis, and (e) interpret the decision in the context of the original claim. Assume the population is normally distributed.
Credit Card Debt A credit reporting agency claims that the mean credit card debt in Colorado is greater than $5540 per borrower. You want to test this claim. You find that a random sample of 30 borrowers has a mean credit card debt of $5594 per person and a standard deviation of $597 per person. At , can you support the claim α=0.05?
Problem 7.3.2
Explain how to use a t-test to test a hypothesized mean mu when sigma is unknown. What assumptions are necessary?
Problem 7.3.3
In Exercises 3–8, find the critical value(s) and rejection region(s) for the type of t-test with level of significance alpha and sample size n.
Left-tailed test, α=0.10, n=20
Problem 7.3.8
In Exercises 3–8, find the critical value(s) and rejection region(s) for the type of t-test with level of significance alpha and sample size n.
Left-tailed test, α=0.10, n=38
Problem 7.3.33
Writing You are testing a claim and incorrectly use the standard normal sampling distribution instead of the t-sampling distribution, mistaking the sample standard deviation for the population standard deviation. Does this make it more or less likely to reject the null hypothesis? Is this result the same no matter whether the test is left-tailed, right-tailed, or two-tailed? Explain your reasoning.
Problem 7.3.6
In Exercises 3–8, find the critical value(s) and rejection region(s) for the type of t-test with level of significance alpha and sample size n.
Right-tailed test, α=0.01, n=31
Problem 7.31
In Exercises 29 –34, find the critical value(s) and rejection region(s) for the type of t-test with level of significance α and sample size n.
Right-tailed test, α=0.02, n=63
Problem 7.4.2
Explain how to test a population proportion p.
Problem 7.4.5
In Exercises 3–8, find the critical value(s) and rejection region(s) for the type of t-test with level of significance alpha and sample size n.
Right-tailed test, α=0.05, n=23
Problem 7.4.7
In Exercises 3–8, find the critical value(s) and rejection region(s) for the type of t-test with level of significance alpha and sample size n.
Two-tailed test, α=0.05, n=27
Problem 7.4.9b
Graphical Analysis In Exercises 9–12, state whether each standardized test statistic t allows you to reject the null hypothesis. Explain.
b. t = 0
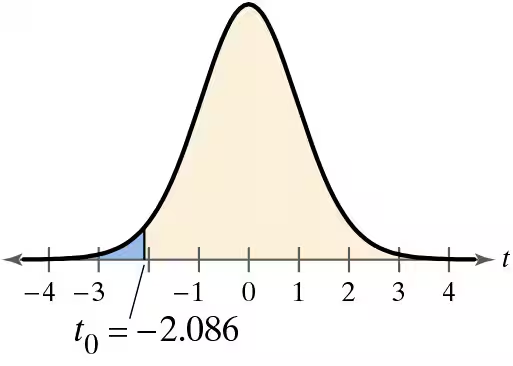
Problem 7.4.9c
Graphical Analysis In Exercises 9–12, state whether each standardized test statistic t allows you to reject the null hypothesis. Explain.
c. t = -2.096