Back
BackProblem 6.R.6
In Exercises 5 and 6, use the confidence interval to find the margin of error and the sample mean.
(7.428, 7.562)
Problem 6.R.11
In Exercises 9–12, find the critical value tc for the level of confidence c and sample size n.
c = 0.98, n = 15
Problem 6.R.1
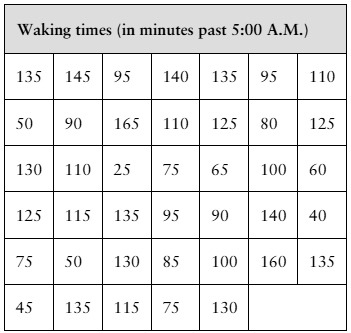
[APPLET] The waking times (in minutes past 5:00 A.M.) of 40 people who start work at 8:00 A.M. are shown in the table at the left. Assume the population standard deviation is 45 minutes. Find (a) the point estimate of the population mean μ and (b) the margin of error for a 90% confidence interval.
Problem 6.R.23
In Exercise 19, would it be unusual for the population proportion to be 38%? Explain.
Problem 6.R.5
In Exercises 5 and 6, use the confidence interval to find the margin of error and the sample mean.
(20.75, 24.10)
Problem 6.R.25b
You wish to estimate, with 95% confidence, the population proportion of U.S. adults who have taken or planned to take a winter vacation in a recent year. Your estimate must be accurate within 5% of the population proportion.
b. Find the minimum sample size needed, using a prior study that found that 32% of U.S. adults have taken or planned to take a winter vacation in a recent year. (Source: Rasmussen Reports)
Problem 6.R.3
(a) Construct a 90% confidence interval for the population mean in Exercise 1. Interpret the results. (b) Does it seem likely that the population mean could be within 10% of the sample mean? Explain.
Problem 6.R.21
In Exercises 19–22, let p be the population proportion for the situation. (a) Find point estimates of p and q, (b) construct 90% and 95% confidence intervals for p, and (c) interpret the results of part (b) and compare the widths of the confidence intervals.
In a survey of 73,901 college graduates, 23,991 obtained a postgraduate degree. (Adapted from Gallup)
Problem 6.R.15
In Exercises 13–16, (a) find the margin of error for the values of c, s, and n, and (b) construct the confidence interval for using the t-distribution. Assume the population is normally distributed.
c = 0.98, s = 0.9, n = 12, xbar = 6.8
Problem 6.RE.27
In Exercises 27–30, find the critical values and for the level of confidence c and sample size n.
c = 0.95, n = 13
Problem 6.RE.28
In Exercises 27–30, find the critical values and for the level of confidence c and sample size n.
c = 0.98, n = 25
Problem 6.RSRD.4
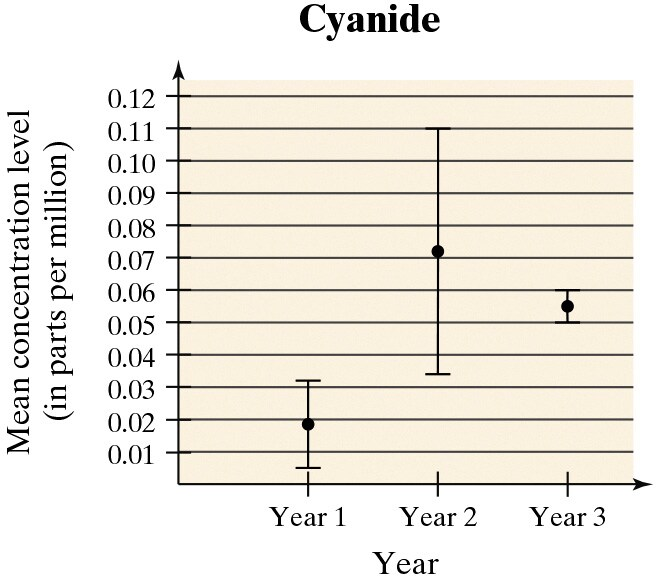
The Safe Drinking Water Act, which was passed in 1974, allows the Environmental Protection Agency (EPA) to regulate the levels of contaminants in drinking water. The EPA requires that water utilities give their customers water quality reports annually. These reports include the results of daily water quality monitoring, which is performed to determine whether drinking water is safe for consumption. A water department tests for contaminants at water treatment plants and at customers’ taps. These contaminants include microorganisms, organic chemicals, and inorganic chemicals, such as cyanide. Cyanide’s presence in drinking water is the result of discharges from steel, plastics, and fertilizer factories. For drinking water, the maximum contaminant level of cyanide is 0.2 parts per million. As part of your job for your city’s water department, you are preparing a report that includes an analysis of the results shown in the figure at the right. The figure shows the point estimates for the population mean concentration and the 95% confidence intervals for cyanide over a three-year period. The data are based on random water samples taken by the city’s three water treatment plants.
What can the water department do to decrease the size of the confidence intervals, regardless of the amount of variance in cyanide levels?
Problem 6.RSRD.3
The Safe Drinking Water Act, which was passed in 1974, allows the Environmental Protection Agency (EPA) to regulate the levels of contaminants in drinking water. The EPA requires that water utilities give their customers water quality reports annually. These reports include the results of daily water quality monitoring, which is performed to determine whether drinking water is safe for consumption. A water department tests for contaminants at water treatment plants and at customers’ taps. These contaminants include microorganisms, organic chemicals, and inorganic chemicals, such as cyanide. Cyanide’s presence in drinking water is the result of discharges from steel, plastics, and fertilizer factories. For drinking water, the maximum contaminant level of cyanide is 0.2 parts per million. As part of your job for your city’s water department, you are preparing a report that includes an analysis of the results shown in the figure at the right. The figure shows the point estimates for the population mean concentration and the 95% confidence intervals for cyanide over a three-year period. The data are based on random water samples taken by the city’s three water treatment plants.
The confidence interval for Year 2 is much larger than that for the other years. What do you think may have caused this larger confidence level?
Problem 6.T.1b
In a survey of 2096 U.S. adults, 1740 think football teams of all levels should require players who suffer a head injury to take a set amount of time off from playing to recover. (Adapted from The Harris Poll)
b. Construct a 95% confidence interval for the population proportion. Interpret the results.
Problem 6.T.4a
Use the standard normal distribution or the t-distribution to construct the indicated confidence interval for the population mean of each data set. Justify your decision. If neither distribution can be used, explain why. Interpret the results.
a. In a random sample of 40 patients, the mean waiting time at a dentist’s office was 20 minutes and the standard deviation was 7.5 minutes. Construct a 95% confidence interval for the population mean.
Problem 6.T.1a
In a survey of 2096 U.S. adults, 1740 think football teams of all levels should require players who suffer a head injury to take a set amount of time off from playing to recover. (Adapted from The Harris Poll)
a. Find the point estimate for the population proportion.
Problem 6.T.2c
The data set represents the weights (in pounds) of 10 randomly selected black bears from northeast Pennsylvania. Assume the weights are normally distributed. (Source: Pennsylvania Game Commission)
c. Construct a 99% confidence interval for the population standard deviation. Interpret the results.
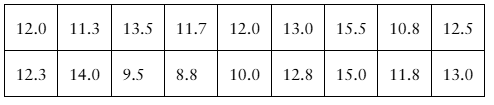
Problem 6.T.2b
The data set represents the weights (in pounds) of 10 randomly selected black bears from northeast Pennsylvania. Assume the weights are normally distributed. (Source: Pennsylvania Game Commission)
b. Construct a 95% confidence interval for the population mean. Interpret the results.
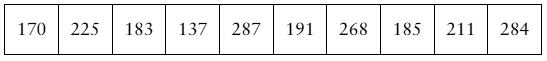
Problem 6.T.3b
The data set represents the scores of 12 randomly selected students on the SAT Physics Subject Test. Assume the population test scores are normally distributed and the population standard deviation is 108. (Adapted from The College Board)
b. Construct a 90% confidence interval for the population mean. Interpret the results.
Problem 6.T.3d
The data set represents the scores of 12 randomly selected students on the SAT Physics Subject Test. Assume the population test scores are normally distributed and the population standard deviation is 108. (Adapted from The College Board)
d. Determine the minimum sample size required to be 95% confident that the sample mean test score is within 10 points of the population mean test score.
Problem 6.T.4b
Use the standard normal distribution or the t-distribution to construct the indicated confidence interval for the population mean of each data set. Justify your decision. If neither distribution can be used, explain why. Interpret the results.
b. In a random sample of 15 cereal boxes, the mean weight was 11.89 ounces. Assume the weights of the cereal boxes are normally distributed and the population standard deviation is 0.05 ounce. Construct a 90% confidence interval for the population mean.
Problem 6.T.3c
The data set represents the scores of 12 randomly selected students on the SAT Physics Subject Test. Assume the population test scores are normally distributed and the population standard deviation is 108. (Adapted from The College Board)
c. Would it be unusual for the population mean to be under 575? Explain.
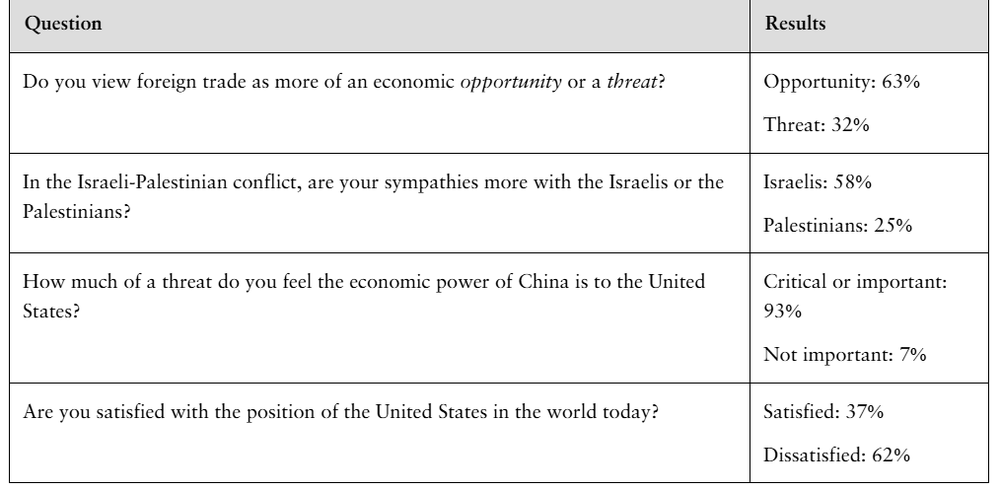
Problem 6.Tech.2
Since 1935, the Gallup Organization has conducted public opinion polls in the United States and around the world. The table shows the results of Gallup’s World Affairs Poll of 2021, in which 1021 U.S. adults were polled. The remaining percentages not shown in the results are adults who were not sure.
[IMAGE]
Find the minimum sample size needed to estimate, with 95% confidence, the population proportion of adults who feel that China’s economic power is a critical or an important economic threat to the United States. Your estimate must be accurate within 2% of the population proportion.
Problem 6.Tech.1a
Since 1935, the Gallup Organization has conducted public opinion polls in the United States and around the world. The table shows the results of Gallup’s World Affairs Poll of 2021, in which 1021 U.S. adults were polled. The remaining percentages not shown in the results are adults who were not sure.
Use technology to find a 95% confidence interval for the population proportion of adults who
a. view foreign trade as an economic opportunity.
Problem 6.Tech.3b
Since 1935, the Gallup Organization has conducted public opinion polls in the United States and around the world. The table shows the results of Gallup’s World Affairs Poll of 2021, in which 1021 U.S. adults were polled. The remaining percentages not shown in the results are adults who were not sure.
b. What was the greatest value you obtained for p^?
Problem 6.1.43a
When all other quantities remain the same, how does the indicated change affect the width of a confidence interval? Explain.
a. Increase in the level of confidence
Problem 6.2.28a
Constructing a Confidence Interval In Exercises 25–28, use the data set to (a) find the sample mean. Assume the population is normally distributed.
Homework The weekly time spent (in hours) on homework for 18 randomly selected high school students
Problem 6.3.19a
Fast Food You wish to estimate, with 90% confidence, the population proportion of U.S. families who eat fast food at least once per week. Your estimate must be accurate within 3% of the population proportion.
a. No preliminary estimate is available. Find the minimum sample size needed.
Problem 6.4.18a
Constructing Confidence Intervals In Exercises 13–24, assume the sample is from a normally distributed population and construct the indicated confidence intervals for (a) the population variance σ^2. Interpret the results.
Volleyball The numbers of service aces scored by 15 teams randomly selected from the top 50 NCAA Division I Women’s Volleyball teams for the 2021 season have a sample standard deviation of 26.1. Use an 80% level of confidence. (Source: National Collegiate Athletic Association)
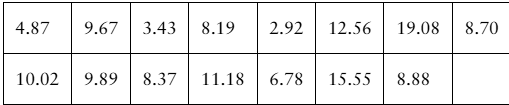
Problem 6.4.14a
Constructing Confidence Intervals In Exercises 13–24, assume the sample is from a normally distributed population and construct the indicated confidence intervals for (a) the population variance σ^2. Interpret the results.
Drug Concentration The times (in minutes) for the drug concentration to peak when the drug epinephrine is injected into 15 randomly selected patients are listed. Use a 90% level of confidence.