Back
BackProblem 6.2.23
You research prices of cell phones and find that the population mean is $431.61. In Exercise 19, does the t-value fall between -t0.95 and t0.95?
Problem 6.3.12
Constructing Confidence Intervals In Exercises 11 and 12, construct 90% and 95% confidence intervals for the population proportion. Interpret the results and compare the widths of the confidence intervals.
New Year’s Resolutions In a survey of 1790 U.S. adults in a recent year, 816 have a New Year’s resolution related to their health. (Adapted from Finder)
Problem 6.3.34
Translating Statements In Exercises 29–34, translate the statement into a confidence interval. Approximate the level of confidence.
In a survey of 1052 parents of children ages 8–14, 68% say they are willing to get a second or part-time job to pay for their children’s college education, and 42% say they lose sleep worrying about college costs. The survey’s margin of error is ±3%. (Source: T. Rowe Price Group, Inc.)
Problem 6.1.31
In Exercises 29–32, determine the minimum sample size n needed to estimate for the values of c, σ, and E.
c = 0.80, σ = 4.1, E = 2.
Problem 6.3.27
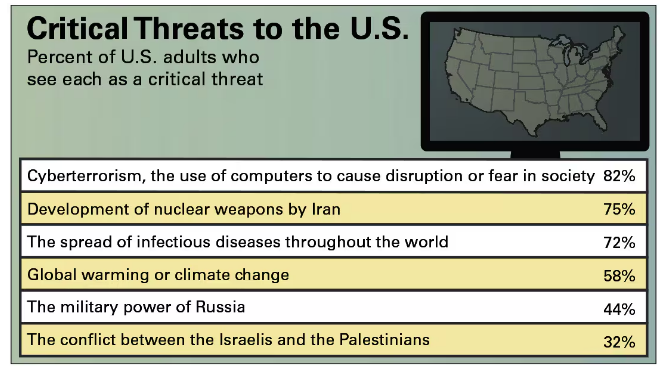
Constructing Confidence Intervals In Exercises 27 and 28, use the figure, which shows the results of a survey in which 1021 U.S. adults were asked whether they see each of the possible threats to the vital interests of the United States as a critical threat in the next 10 years. (Source: Gallup)
Critical Threats Construct a 95% confidence interval for the population proportion of U.S. adults who gave each response.
Problem 6.3.21
In Exercise 11, would it be unusual for the population proportion to be 72.5%? Explain.
Problem 6.3.14
Constructing Confidence Intervals In Exercises 13 and 14, construct a 99% confidence interval for the population proportion. Interpret the results.
New Year’s Resolutions In a survey of 1790 U.S. adults in a recent year, 816 have a New Year’s resolution related to their health. (Adapted from Finder)
Problem 6.1.29
In Exercises 29–32, determine the minimum sample size n needed to estimate for the values of c, σ, and E.
c = 0.90, σ = 6.8, E = 1.
Problem 6.1.13
In Exercises 13–16, find the margin of error for the values of c, σ and n.
c = 0.95, σ = 5.2, n = 30
Problem 6.4.5
Finding Critical Values for χ2 In Exercises 3–8, find the critical values χR2 and χL2 for the level of confidence c and sample size n.
c = 0.95, n = 20
Problem 6.3.32
Translating Statements In Exercises 29–34, translate the statement into a confidence interval. Approximate the level of confidence.
In a survey of 880 unmarried U.S. adults who are living with a partner, 73% say love was a major reason why they decided to move in together. The survey’s margin of error is ±4.8%. (Source: Pew Research Center)
Problem 6.4.8
Finding Critical Values for χ2 In Exercises 3–8, find the critical values χR2 and χL2 for the level of confidence c and sample size n.
c = 0.80, n = 51
Problem 6.2.2
Describe how the t-distribution curve changes as the sample size increases.
Problem 6.1.10
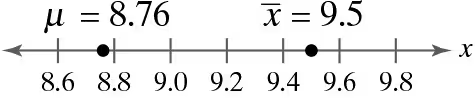
Graphical Analysis In Exercises 9–12, use the values on the number line to find the sampling error.
Problem 6.Q.3c
The data set represents the amounts of time (in minutes) spent checking email for a random sample of employees at a company.
c. Repeat part (b), assuming σ = 3.5 minutes. Compare the results.
Problem 6.Q.1a
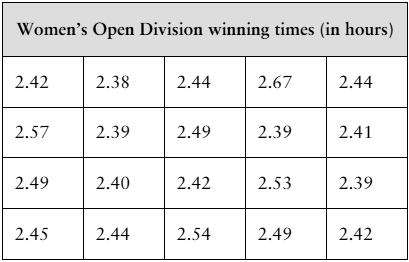
[APPLET] The winning times (in hours) for a sample of 20 randomly selected Boston Marathon Women’s Open Division champions from 1980 to 2019 are shown in the table at the left. Assume the population standard deviation is 0.068 hour. (Source: Boston Athletic Association)
a. Find the point estimate of the population mean.
Problem 6.Q.4
In a random sample of 12 senior-level civil engineers, the mean annual earnings were $133,326 and the standard deviation was $36,729. Assume the annual earnings are normally distributed and construct a 95% confidence interval for the population mean annual earnings for senior-level civil engineers. Interpret the results. (Adapted from Salary.com)
Problem 6.Q.1d
[APPLET] The winning times (in hours) for a sample of 20 randomly selected Boston Marathon Women’s Open Division champions from 1980 to 2019 are shown in the table at the left. Assume the population standard deviation is 0.068 hour. (Source: Boston Athletic Association)
d. Does it seem likely that the population mean could be greater than 2.52 hours? Explain.
Problem 6.Q.5
You research the salaries of senior-level civil engineers and find that the population mean is $131,935. In Exercise 4, does the t-value fall between -t0.95 and t0.95?
Problem 6.Q.1b
[APPLET] The winning times (in hours) for a sample of 20 randomly selected Boston Marathon Women’s Open Division champions from 1980 to 2019 are shown in the table at the left. Assume the population standard deviation is 0.068 hour. (Source: Boston Athletic Association)
b. Find the margin of error for a 95% confidence level.
Problem 6.Q.2
You wish to estimate the mean winning time for Boston Marathon Women’s Open Division champions. The estimate must be within 2 minutes of the population mean. Determine the minimum sample size required to construct a 99% confidence interval for the population mean. Use the population standard deviation from Exercise 1.
Problem 6.R.8
Determine the minimum sample size required to be 99% confident that the sample mean driving distance to work is within 2 miles of the population mean driving distance to work. Use the population standard deviation from Exercise 2.
Problem 6.R.17
In a random sample of 36 top-rated roller coasters, the average height is 165 feet and the standard deviation is 67 feet. Construct a 90% confidence interval for μ. Interpret the results. (Source: POP World Media, LLC)
Problem 6.R.19
In Exercises 19–22, let p be the population proportion for the situation. (a) Find point estimates of p and q, (b) construct 90% and 95% confidence intervals for p, and (c) interpret the results of part (b) and compare the widths of the confidence intervals.
In a survey of 912 U.S. adults in Generation Z (born after 1996), 383 said they are at least somewhat likely to consider an electric vehicle for their next vehicle purchase. (Adapted from Pew Research Center)
Problem 6.R.29
In Exercises 27–30, find the critical values and for the level of confidence c and sample size n.
c = 0.90, n = 16
Problem 6.R.25a
You wish to estimate, with 95% confidence, the population proportion of U.S. adults who have taken or planned to take a winter vacation in a recent year. Your estimate must be accurate within 5% of the population proportion.
a. No preliminary estimate is available. Find the minimum sample size needed.
Problem 6.R.30
In Exercises 27–30, find the critical values and for the level of confidence c and sample size n.
c = 0.99, n = 10
Problem 6.R.21
In Exercises 19–22, let p be the population proportion for the situation. (a) Find point estimates of p and q, (b) construct 90% and 95% confidence intervals for p, and (c) interpret the results of part (b) and compare the widths of the confidence intervals.
In a survey of 73,901 college graduates, 23,991 obtained a postgraduate degree. (Adapted from Gallup)
Problem 6.R.25b
You wish to estimate, with 95% confidence, the population proportion of U.S. adults who have taken or planned to take a winter vacation in a recent year. Your estimate must be accurate within 5% of the population proportion.
b. Find the minimum sample size needed, using a prior study that found that 32% of U.S. adults have taken or planned to take a winter vacation in a recent year. (Source: Rasmussen Reports)
Problem 6.R.5
In Exercises 5 and 6, use the confidence interval to find the margin of error and the sample mean.
(20.75, 24.10)