Back
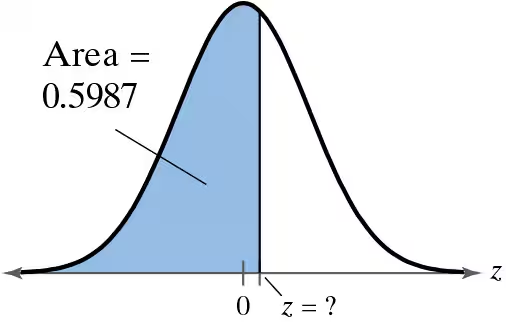
BackProblem 5.3.18
Graphical Analysis In Exercises 17–22, find the indicated z-score(s) shown in the graph.
Problem 5.1.39
Computing and Interpreting z-Scores In Exercises 39 and 40, (a) find the z-score that corresponds to each value and (b) determine whether any of the values are unusual.
Stanford-Binet IQ Scores The test scores for the Stanford-Binet Intelligence Scale are normally distributed with a mean score of 100 and a standard deviation of 16. The test scores of four students selected at random are 98, 65, 106, and 124.
Problem 5.1.3
Describe the inflection points on the graph of a normal distribution. At what x-values are the inflection points located?
Problem 5.1.31
Finding Area
In Exercises 23–36, find the indicated area under the standard normal curve. If convenient, use technology to find the area.
Between z=0 and z=2.86
Problem 5.1.8
Explain how to transform a given x-value of a normally distributed variable x into a z-score.
Problem 5.1.23
Finding Area
In Exercises 23–36, find the indicated area under the standard normal curve. If convenient, use technology to find the area.
To the left of z=0.33
Problem 5.1.45
Finding Probability In Exercises 41– 46, find the probability of z occurring in the shaded region of the standard normal distribution. If convenient, use technology to find the probability.
Problem 5.5.13
In Exercises 9–14, write the binomial probability in words. Then, use a continuity correction to convert the binomial probability to a normal distribution probability.
P(x ≤ 150)
Problem 5.4.31
Finding Probabilities for Sampling Distributions In Exercises 29–32, find the indicated probability and interpret the results.
Asthma Prevalence by State The mean percent of asthma prevalence of the 50 U.S. states is 9.51%. A random sample of 30 states is selected. What is the probability that the mean percent of asthma prevalence for the sample is greater than 10%? Assume sigma=1.17%
Problem 5.4.1
In Exercises 1– 4, a population has a mean mu and a standard deviation sigma. Find the mean and standard deviation of the sampling distribution of sample means with sample size n.
Mu = 150, sigma =25, n = 49
Problem 5.3.30
Finding a z-Score Given an Area In Exercises 23–30, find the indicated z-score.
Find the positive z-score for which 12% of the distribution’s area lies between and z.
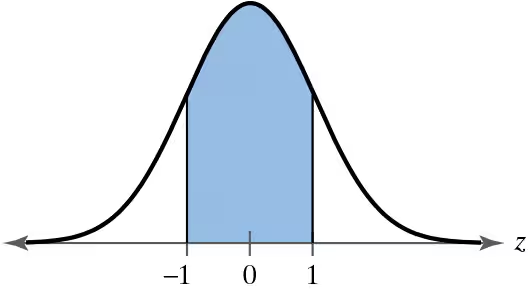
Problem 5.1.33
Finding Area In Exercises 23–36, find the indicated area under the standard normal curve. If convenient, use technology to find the area.
Between z= -1.55 and z= 1.55
Problem 5.1.54
Finding Probability In Exercises 47–56, find the indicated probability using the standard normal distribution. If convenient, use technology to find the probability.
P(- 1.54 < z < 1.54)
Problem 5.4.3
In Exercises 1– 4, a population has a mean mu and a standard deviation sigma. Find the mean and standard deviation of the sampling distribution of sample means with sample size n.
Mu = 790, sigma =48, n = 250
Problem 5.5.32
Testing a Drug A drug manufacturer claims that a drug cures a rare skin disease 75% of the time. The claim is checked by testing the drug on 100 patients. If at least 70 patients are cured, then this claim will be accepted. Use this information in Exercises 31 and 32.
Find the probability that the claim will be accepted, assuming that the actual probability that the drug cures the skin disease is 65%.
Problem 5.4.18
Finding Probabilities In Exercises 15–18, the population mean and standard deviation are given. Find the indicated probability and determine whether the given sample mean would be considered unusual.
For a random sample of n=36, find the probability of a sample mean being less than 12,750 or greater than 12,753 when mu=12750 and 1.7.
Problem 5.4.26
Interpreting the Central Limit Theorem In Exercises 19–26, find the mean and standard deviation of the indicated sampling distribution of sample means. Then sketch a graph of the sampling distribution.
SAT Italian Subject Test The scores on the SAT Italian Subject Test for the 2018–2020 graduating classes are normally distributed, with a mean of 628 and a standard deviation of 110. Random samples of size 25 are drawn from this population, and the mean of each sample is determined.
Problem 5.1.35
Finding Area In Exercises 23–36, find the indicated area under the standard normal curve. If convenient, use technology to find the area.
To the left of z= -1.28 and to the right of z= 1.28
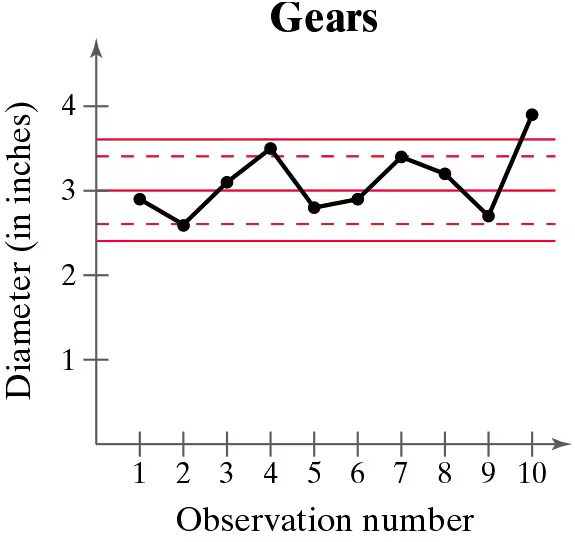
Problem 5.2.21
In Exercises 21–24, a control chart is shown. Each chart has horizontal lines drawn at the mean mu, at mu ±2sigma, and at mu±3sigma. Determine whether the process shown is in control or out of control. Explain.
A gear has been designed to have a diameter of 3 inches. The standard deviation of the process is 0.2 inch.
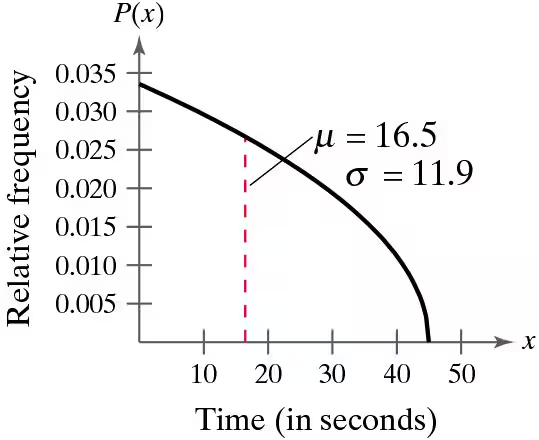
Problem 5.4.9
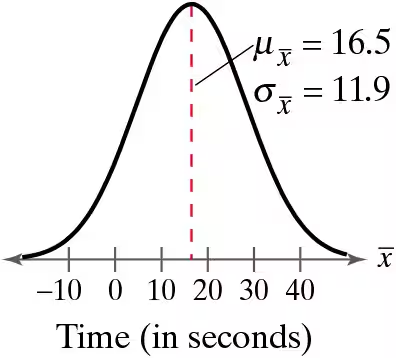
Graphical Analysis In Exercises 9 and 10, the graph of a population distribution is shown with its mean and standard deviation. Random samples of size 100 are drawn from the population. Determine which of the figures labeled (a)–(c) would most closely resemble the sampling distribution of sample means. Explain your reasoning.
The waiting time (in seconds) to turn left at an intersection
Problem 5.2.6
Computing Probabilities for Normal Distributions In Exercises 1–6, the random variable x is normally distributed with mean mu=174 and standard deviation sigma=20. Find the indicated probability.
P(172 < x <192)
Problem 5.4.24
Interpreting the Central Limit Theorem In Exercises 19–26, find the mean and standard deviation of the indicated sampling distribution of sample means. Then sketch a graph of the sampling distribution.
Salaries The annual salaries for web software development managers are normally distributed, with a mean of about $136,000 and a standard deviation of about $11,500. Random samples of 40 are drawn from this population, and the mean of each sample is determined.
Problem 5.1.11
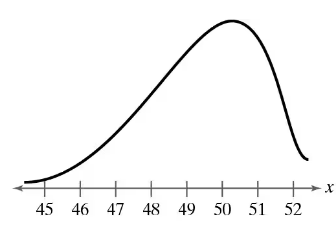
Graphical Analysis In Exercises 11–16, determine whether the graph could represent a variable with a normal distribution. Explain your reasoning. If the graph appears to represent a normal distribution, estimate the mean and standard deviation.
Problem 5.5.1
In Exercises 1–4, the sample size n, probability of success p, and probability of failure q are given for a binomial experiment. Determine whether you can use a normal distribution to approximate the distribution of x.
n=24, p=0.85, q=0.15
Problem 5.4.19
Interpreting the Central Limit Theorem In Exercises 19–26, find the mean and standard deviation of the indicated sampling distribution of sample means. Then sketch a graph of the sampling distribution.
Renewable Energy During a recent period of two years, the day-ahead prices for renewable energy in Germany (in euros per mega-watt hour) have a mean of 31.58 and a standard deviation of 12.293. Random samples of size 75 are drawn from this population, and the mean of each sample is determined.
Problem 5.5.3
In Exercises 1–4, the sample size n, probability of success p, and probability of failure q are given for a binomial experiment. Determine whether you can use a normal distribution to approximate the distribution of x.
n=18, p=0.90, q=0.10
Problem 5.5.30
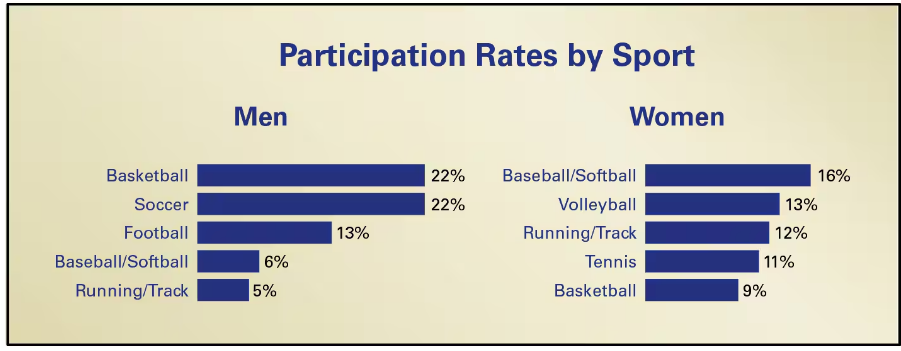
"Getting Physical The figure shows the results of a survey of U.S. adults ages 18 to 29 who were asked whether they participated in a sport. In the survey, 48% of the men and 23% of the women said they participate in sports. The most common sports are shown below. Use this information in Exercises 29 and 30.
You randomly select 300 U.S. women ages 18 to 29 and ask them whether they participate in at least one sport. Of the 72 who say yes, 50% say they participate in volleyball. How likely is this result? Do you think this sample is a good one? Explain your reasoning."
Problem 5.4.29
Finding Probabilities for Sampling Distributions In Exercises 29–32, find the indicated probability and interpret the results.
Dow Jones Industrial Average From 1975 through 2020, the mean annual gain of the Dow Jones Industrial Average was 652. A random sample of 32 years is selected from this population. What is the probability that the mean gain for the sample was between 400 and 700? Assume sigma=1540
Problem 5.1.5
Draw two normal curves that have the same mean but different standard deviations. Describe the similarities and differences.
Problem 5.4.39
In Exercises 39 and 40, determine whether the finite correction factor should be used. If so, use it in your calculations when you find the probability.
Parking Infractions In a sample of 1000 fines issued by the City of Toronto for parking infractions in September of 2020, the mean fine was $49.83 and the standard deviation was $52.15. A random sample of size 60 is selected from this population. What is the probability that the mean fine is less than $40?