Back
BackProblem 6.2.28a
Constructing a Confidence Interval In Exercises 25–28, use the data set to (a) find the sample mean. Assume the population is normally distributed.
Homework The weekly time spent (in hours) on homework for 18 randomly selected high school students
Problem 6.3.19a
Fast Food You wish to estimate, with 90% confidence, the population proportion of U.S. families who eat fast food at least once per week. Your estimate must be accurate within 3% of the population proportion.
a. No preliminary estimate is available. Find the minimum sample size needed.
Problem 6.4.18a
Constructing Confidence Intervals In Exercises 13–24, assume the sample is from a normally distributed population and construct the indicated confidence intervals for (a) the population variance σ^2. Interpret the results.
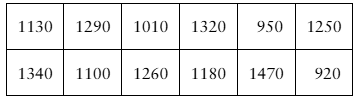
Volleyball The numbers of service aces scored by 15 teams randomly selected from the top 50 NCAA Division I Women’s Volleyball teams for the 2021 season have a sample standard deviation of 26.1. Use an 80% level of confidence. (Source: National Collegiate Athletic Association)
Problem 6.2.25a
Constructing a Confidence Interval In Exercises 25–28, use the data set to (a) find the sample mean. Assume the population is normally distributed.
SAT Scores The SAT scores of 12 randomly selected high school seniors
Problem 6.1.50a
Ages of College Students An admissions director wants to estimate the mean age of all students enrolled at a college. The estimate must be within 1.5 years of the population mean. Assume the population of ages is normally distributed.
a. Determine the minimum sample size required to construct a 90% confidence interval for the population mean. Assume the population standard deviation is 1.6 years.
Problem 6.4.14a
Constructing Confidence Intervals In Exercises 13–24, assume the sample is from a normally distributed population and construct the indicated confidence intervals for (a) the population variance σ^2. Interpret the results.
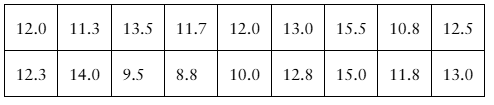
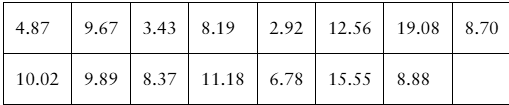
Drug Concentration The times (in minutes) for the drug concentration to peak when the drug epinephrine is injected into 15 randomly selected patients are listed. Use a 90% level of confidence.
Problem 6.3.17a
Congress You wish to estimate, with 95% confidence, the population proportion of likely U.S. voters who think Congress is doing a good or excellent job. Your estimate must be accurate within 4% of the population proportion.
a. No preliminary estimate is available. Find the minimum sample size needed.
Problem 6.4.23a
Constructing Confidence Intervals In Exercises 13–24, assume the sample is from a normally distributed population and construct the indicated confidence intervals for (a) the population variance σ^2. Interpret the results.
Drive-Thru Times The times (in seconds) spent by a random sample of 28 customers in the drive-thru of a fast-food restaurant have a sample standard deviation of 56.1. Use a 98% level of confidence.
Problem 6.4.21a
Constructing Confidence Intervals In Exercises 13–24, assume the sample is from a normally distributed population and construct the indicated confidence intervals for (a) the population variance σ^2. Interpret the results.
Car Batteries The reserve capacities (in hours) of 18 randomly selected automotive batteries have a sample standard deviation of 0.25 hour. Use an 80% level of confidence.
Problem 6.1.58a
Finite Population Correction Factor In Exercises 57 and 58, use the information below.
In this section, you studied the construction of a confidence interval to estimate a population mean. In each case, the underlying assumption was that the sample size n was small in comparison to the population size N. When n ≥ 0.05N however, the formula that determines the standard error of the mean needs to be adjusted, as shown below.
[IMAGE]
Recall from the Section 5.4 exercises that the expression sqrt[(N-n)/(n-1)] is called a finite population correction factor. The margin of error is
[IMAGE]
Use the finite population correction factor to construct each confidence interval for the population mean.
a. c = 0.99, xbar = 8.6, σ = 4.9, N = 200, n = 25.
Problem 6.3.20a
Alcohol-Impaired Driving You wish to estimate, with 95% confidence, the population proportion of motor vehicle fatalities that were caused by alcohol-impaired driving. Your estimate must be accurate within 5% of the population proportion.
a. No preliminary estimate is available. Find the minimum sample size needed
Problem 6.4.15a
Constructing Confidence Intervals In Exercises 13–24, assume the sample is from a normally distributed population and construct the indicated confidence intervals for (a) the population variance σ^2. Interpret the results.
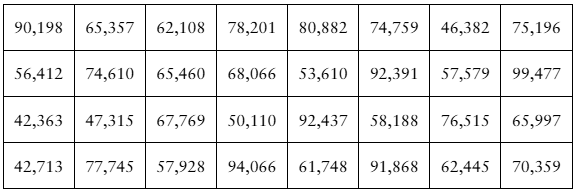
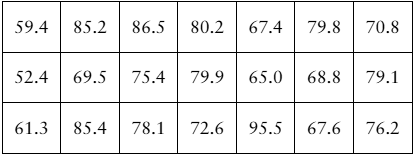
[APPLET] Earnings The annual earnings (in thousands of dollars) of 21 randomly selected level 1 computer hardware engineers are listed. Use a 99% level of confidence. (Adapted from Salary.com)
Problem 6.1.53a
Soccer Balls A soccer ball manufacturer wants to estimate the mean circumference of soccer balls within 0.15 inch.
a. Determine the minimum sample size required to construct a 99% confidence interval for the population mean. Assume the population standard deviation is 0.5 inch
Problem 6.2.31a
Constructing a Confidence Interval In Exercises 31 and 32, use the data set to (a) find the sample mean
[APPLET] Earnings The annual earnings (in dollars) of 32 randomly selected intermediate level life insurance underwriters (Adapted from Salary.com)
Problem 6.1.51a
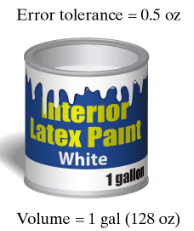
Paint Can Volumes A paint manufacturer uses a machine to fill gallon cans with paint (see figure). The manufacturer wants to estimate the mean volume of paint the machine is putting in the cans within 0.5 ounce. Assume the population of volumes is normally distributed.
a. Determine the minimum sample size required to construct a 90% confidence interval for the population mean. Assume the population standard deviation is 0.75 ounce.
Problem 6.3.20b
Alcohol-Impaired Driving You wish to estimate, with 95% confidence, the population proportion of motor vehicle fatalities that were caused by alcohol-impaired driving. Your estimate must be accurate within 5% of the population proportion.
b. Find the minimum sample size needed, using a prior study that found that 28% of motor vehicle fatalities were caused by alcohol-impaired driving. (Source: National Highway Traffic Safety Administration)
Problem 6.4.18b
Constructing Confidence Intervals In Exercises 13–24, assume the sample is from a normally distributed population and construct the indicated confidence intervals for (a) the population variance σ^2. Interpret the results.
Volleyball The numbers of service aces scored by 15 teams randomly selected from the top 50 NCAA Division I Women’s Volleyball teams for the 2021 season have a sample standard deviation of 26.1. Use an 80% level of confidence. (Source: National Collegiate Athletic Association)
Problem 6.1.56b
When all other quantities remain the same, how does the indicated change affect the minimum sample size requirement? Explain.
b. Increase in the error tolerance
Problem 6.3.18b
Senate Filibuster You wish to estimate, with 99% confidence, the population proportion of U.S. adults who disapprove of the U.S Senate’s use of the filibuster. Your estimate must be accurate within 2% of the population proportion.
b. Find the minimum sample size needed, using a prior survey that found that 34% of U.S. adults disapprove of the U.S Senate’s use of the filibuster. (Source: Monmouth University)
Problem 6.2.25b
Constructing a Confidence Interval In Exercises 25–28, use the data set to (b) find the sample standard deviation. Assume the population is normally distributed.
SAT Scores The SAT scores of 12 randomly selected high school seniors
Problem 6.4.21b
Constructing Confidence Intervals In Exercises 13–24, assume the sample is from a normally distributed population and construct the indicated confidence intervals for (b) the population standard deviation σ. Interpret the results.
Car Batteries The reserve capacities (in hours) of 18 randomly selected automotive batteries have a sample standard deviation of 0.25 hour. Use an 80% level of confidence.
Problem 6.4.23b
Constructing Confidence Intervals In Exercises 13–24, assume the sample is from a normally distributed population and construct the indicated confidence intervals for (b) the population standard deviation σ. Interpret the results.
Drive-Thru Times The times (in seconds) spent by a random sample of 28 customers in the drive-thru of a fast-food restaurant have a sample standard deviation of 56.1. Use a 98% level of confidence.
Problem 6.1.43b
When all other quantities remain the same, how does the indicated change affect the width of a confidence interval? Explain.
b. Increase in the sample size
Problem 6.2.31b
Constructing a Confidence Interval In Exercises 31 and 32, use the data set to (b) find the sample standard deviation
[APPLET] Earnings The annual earnings (in dollars) of 32 randomly selected intermediate level life insurance underwriters (Adapted from Salary.com)
Problem 6.3.19b
Fast Food You wish to estimate, with 90% confidence, the population proportion of U.S. families who eat fast food at least once per week. Your estimate must be accurate within 3% of the population proportion.
b. Find the minimum sample size needed, using a prior study that found that 83% of U.S. families eat fast food at least once per week. (Source: The Barbecue Lab)
Problem 6.4.15b
Constructing Confidence Intervals In Exercises 13–24, assume the sample is from a normally distributed population and construct the indicated confidence intervals for (b) the population standard deviation σ. Interpret the results.
[APPLET] Earnings The annual earnings (in thousands of dollars) of 21 randomly selected level 1 computer hardware engineers are listed. Use a 99% level of confidence. (Adapted from Salary.com)
Problem 6.4.14b
Constructing Confidence Intervals In Exercises 13–24, assume the sample is from a normally distributed population and construct the indicated confidence intervals for (b) the population standard deviation σ. Interpret the results.
Drug Concentration The times (in minutes) for the drug concentration to peak when the drug epinephrine is injected into 15 randomly selected patients are listed. Use a 90% level of confidence.
Problem 6.3.17b
Congress You wish to estimate, with 95% confidence, the population proportion of likely U.S. voters who think Congress is doing a good or excellent job. Your estimate must be accurate within 4% of the population proportion.
b. Find the minimum sample size needed, using a prior survey that found that 21% of likely U.S. voters think Congress is doing a good or excellent job. (Source: Rasmussen Reports)
Problem 6.4.22b
Constructing Confidence Intervals In Exercises 13–24, assume the sample is from a normally distributed population and construct the indicated confidence intervals for (b) the population standard deviation σ. Interpret the results.
Annual Precipitation The annual precipitation amounts (in inches) of a random sample of 61 years for Chicago, Illinois, have a sample standard deviation of 6.46. Use a 98% level of confidence. (Source: National Oceanic and Atmospheric Administration)
Problem 6.1.43c
When all other quantities remain the same, how does the indicated change affect the width of a confidence interval? Explain.
c. Increase in the population standard deviation