Back
BackProblem 6.1.10
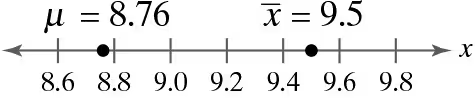
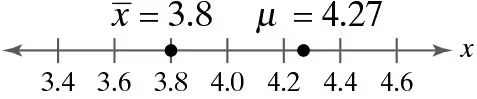
Graphical Analysis In Exercises 9–12, use the values on the number line to find the sampling error.
Problem 6.1.29
In Exercises 29–32, determine the minimum sample size n needed to estimate for the values of c, σ, and E.
c = 0.90, σ = 6.8, E = 1.
Problem 6.1.20
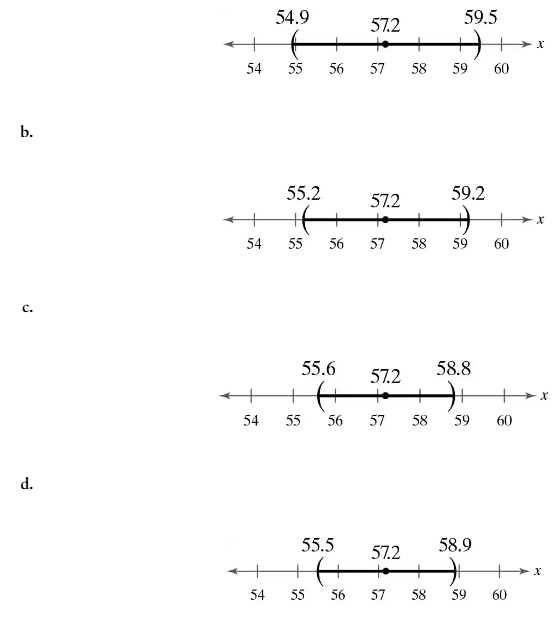
Matching In Exercises 17–20, match the level of confidence c with the appropriate confidence interval. Assume each confidence interval is constructed for the same sample statistics.
c = 0.98
Problem 6.3.12
Constructing Confidence Intervals In Exercises 11 and 12, construct 90% and 95% confidence intervals for the population proportion. Interpret the results and compare the widths of the confidence intervals.
New Year’s Resolutions In a survey of 1790 U.S. adults in a recent year, 816 have a New Year’s resolution related to their health. (Adapted from Finder)
Problem 6.3.34
Translating Statements In Exercises 29–34, translate the statement into a confidence interval. Approximate the level of confidence.
In a survey of 1052 parents of children ages 8–14, 68% say they are willing to get a second or part-time job to pay for their children’s college education, and 42% say they lose sleep worrying about college costs. The survey’s margin of error is ±3%. (Source: T. Rowe Price Group, Inc.)
Problem 6.3.30
Translating Statements In Exercises 29–34, translate the statement into a confidence interval. Approximate the level of confidence.
In a survey of 220 U.S. adults ages 18–29, 65% said that they use Snapchat. The survey’s margin of error is ±7.9%. (Source: Pew Research Center)
Problem 6.1.17
Matching In Exercises 17–20, match the level of confidence c with the appropriate confidence interval. Assume each confidence interval is constructed for the same sample statistics.
c = 0.88
Problem 6.4.5
Finding Critical Values for χ2 In Exercises 3–8, find the critical values χR2 and χL2 for the level of confidence c and sample size n.
c = 0.95, n = 20
Problem 6.3.29
Translating Statements In Exercises 29–34, translate the statement into a confidence interval. Approximate the level of confidence.
In a survey of 1502 U.S. adults, 31% said that they use Pinterest. The survey’s margin of error is ±2.9%. (Source: Pew Research Center)
Problem 6.1.16
In Exercises 13–16, find the margin of error for the values of c, σ and n.
c = 0.975, σ = 4.6, n = 100
Problem 6.1.48
Determining a Minimum Sample Size Determine the minimum sample size required when you want to be 99% confident that the sample mean is within two units of the population mean and σ = 1.4. Assume the population is normally distributed.
Problem 6.1.41
In Exercise 37, does it seem likely that the population mean could be greater than $70? Explain.
Problem 6.1.3
For the same sample statistics, which level of confidence would produce the widest confidence interval? Explain your reasoning.
a. 90%
b. 95%
c. 98%
d. 99%
Problem 6.3.14
Constructing Confidence Intervals In Exercises 13 and 14, construct a 99% confidence interval for the population proportion. Interpret the results.
New Year’s Resolutions In a survey of 1790 U.S. adults in a recent year, 816 have a New Year’s resolution related to their health. (Adapted from Finder)
Problem 6.1.34
Finding the Margin of Error In Exercises 33 and 34, use the confidence interval to find the estimated margin of error. Then find the sample mean. Book Prices A store manager reports a confidence interval of (244.07, 280.97) when estimating the mean price (in dollars) for the population of textbooks.
Problem 6.3.27
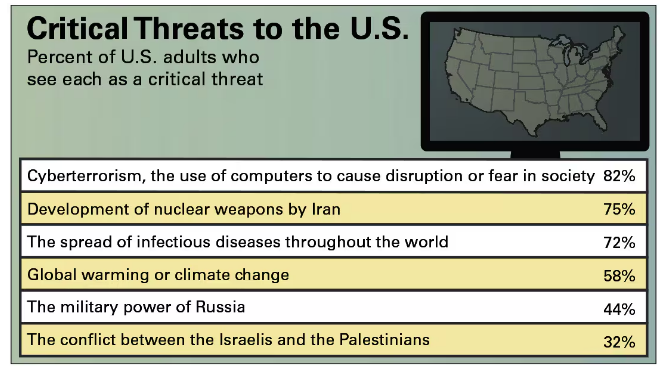
Constructing Confidence Intervals In Exercises 27 and 28, use the figure, which shows the results of a survey in which 1021 U.S. adults were asked whether they see each of the possible threats to the vital interests of the United States as a critical threat in the next 10 years. (Source: Gallup)
Critical Threats Construct a 95% confidence interval for the population proportion of U.S. adults who gave each response.
Problem 6.2.36
In Exercises 35–40, use the standard normal distribution or the t-distribution to construct a 95% confidence interval for the population mean. Justify your decision. If neither distribution can be used, explain why. Interpret the results.
In a random sample of 18 months from January 2011 through December 2020, the mean interest rate for 30-year fixed rate home mortgages was 3.95% and the standard deviation was 0.49%. Assume the interest rates are normally distributed. (Source: Freddie Mac)
Problem 6.4.8
Finding Critical Values for χ2 In Exercises 3–8, find the critical values χR2 and χL2 for the level of confidence c and sample size n.
c = 0.80, n = 51
Problem 6.3.16
Bisexual Idenfitication In a survey of 692 lesbian, gay, bisexual, or transgender U.S adults, 378 said that they consider themselves bisexual. Construct a 90% confidence interval for the population proportion of lesbian, gay, bisexual, or transgender U.S. adults who consider themselves bisexual. (Adapted from Gallup)
Problem 6.2.37
In Exercises 35–40, use the standard normal distribution or the t-distribution to construct a 95% confidence interval for the population mean. Justify your decision. If neither distribution can be used, explain why. Interpret the results.
The population standard deviation of the weights of the two-year-old males on a pediatrician’s patient list is 2.49 pounds. The mean weight of a sample of 10 of the two–year–old males is 13.68 pounds. Weights are known to be normally distributed.
Problem 6.1.9
Graphical Analysis In Exercises 9–12, use the values on the number line to find the sampling error.
Problem 6.3.4
"Finding p^ and q^ In Exercises 3 – 6, let p be the population proportion for the situation. Find point estimates of p and q.
Social Security In a survey of 351 retired Americans, 200 said that they rely on Social Security as major source of income. (Adapted from Gallup)"
Problem 6.4.10
In Exercises 9–12, construct the indicated confidence intervals for (a) the population variance and (b) the population standard deviation . Assume the sample is from a normally distributed population.
c = 0.99, s^2 = 0.64, n = 7
Problem 6.3.35
Why Check It? Why is it necessary to check that np^ ≥ 5 and nq^ ≥ 5?
Problem 6.2.12
In Exercises 9–12, construct the indicated confidence interval for the population mean μ using the t-distribution. Assume the population is normally distributed.
c = 0.99, xbar = 24.7, s = 4.6, n = 50
Problem 6.4.3
Finding Critical Values for χ2 In Exercises 3–8, find the critical values χR2 and χL2 for the level of confidence c and sample size n.
c = 0.90, n = 8
Problem 6.1.28
In Exercises 25–28, use the confidence interval to find the margin of error and the sample mean.
(3.144, 3.176)
Problem 6.2.23
You research prices of cell phones and find that the population mean is $431.61. In Exercise 19, does the t-value fall between -t0.95 and t0.95?
Problem 6.1.5
In Exercises 5–8, find the critical value zc necessary to construct a confidence interval at the level of confidence c.
c = 0.80
Problem 6.2.15
In Exercises 15 and 16, find the t-value for the given values of xbar, μ, s and n.
xbar = 70.3, μ = 64.8, s = 7.1, n = 16