Back
BackProblem 5.R.59b
In Exercises 55–60, find the indicated probabilities and interpret the results.
The mean annual salary for Level 1 actuaries in the United States is about $72,000. A random sample of 45 Level 1 actuaries is selected. What is the probability that the mean annual salary of the sample is (b) more than $68,000? Assume sigma = $11,000.
Problem 5.R.48
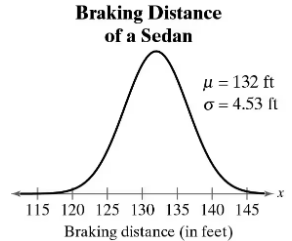
What braking distance represents the first quartile?
Problem 5.R.51b
In Exercises 51 and 52, a population and sample size are given. (b) List all samples (with replacement) of the given size from the population and find the mean of each. (c) Find the mean and standard deviation of the sampling distribution of sample means and compare them with the mean and standard deviation of the population.
The goals scored in a season by the four starting defenders on a soccer team are 1, 2, 0, and 3. Use a sample size of 2.
Problem 5.R.53
In Exercises 53 and 54, find the mean and standard deviation of the indicated sampling distribution of sample means. Then sketch a graph of the sampling distribution.
The population densities in people per square mile in the 50 U.S. states have a mean of 199.6 and a standard deviation of 265.4. Random samples of size 35 are drawn from this population, and the mean of each sample is determined.
Problem 5.RE.17
In Exercises 7–18, find the indicated area under the standard normal curve. If convenient, use technology to find the area.
To the left of z = -1.5 and to the right of z = 1.5
Problem 5.RE.44
Find the positive z-score for which 94% of the distribution’s area lies between -z and z.
Problem 5.RE.34a
In Exercises 33 and 34, find the indicated probabilities. If convenient, use technology to find the probabilities.
The daily surface concentration of carbonyl sulfide on the Indian Ocean is normally distributed, with a mean of 9.1 picomoles per liter and a standard deviation of 3.5 picomoles per liter. Find the probability that on a randomly selected day, the surface concentration of carbonyl sulfide on the Indian Ocean is
a. between 5.1 and 15.7 picomoles per liter.
Problem 5.RE.2
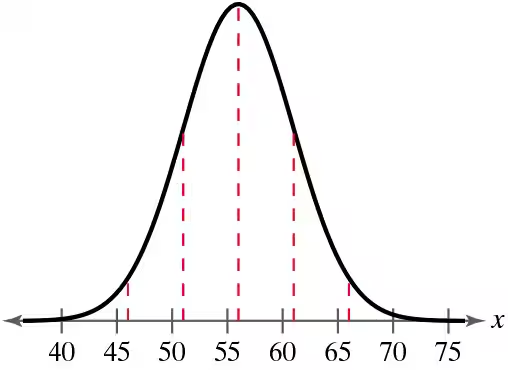
In Exercises 1 and 2, use the normal curve to estimate the mean and standard deviation.
Problem 5.RE.5
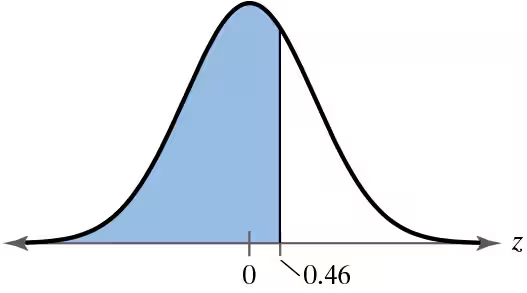
In Exercises 5 and 6, find the area of the indicated region under the standard normal curve. If convenient, use technology to find the area.
Problem 5.RE.11
In Exercises 7–18, find the indicated area under the standard normal curve. If convenient, use technology to find the area.
To the left of z = -2.825
Problem 5.RE.14
In Exercises 7–18, find the indicated area under the standard normal curve. If convenient, use technology to find the area.
Between z = -1.55 and z = 1.04
Problem 5.RE.32
In Exercises 27–32, the random variable x is normally distributed with mean mu=74 and standard deviation sigma=8. Find the indicated probability.
P(72 < x < 82)
Problem 5.RE.21
In Exercises 21–26, find the indicated probability using the standard normal distribution. If convenient, use technology to find the probability.
P(z < 1.28)
Problem 5.RE.28
In Exercises 27–32, the random variable x is normally distributed with mean mu=74 and standard deviation sigma=8. Find the indicated probability.
P(x < 55)
Problem 5.RE.24
In Exercises 21–26, find the indicated probability using the standard normal distribution. If convenient, use technology to find the probability.
P(0.42 < z < 3.15)
Problem 5.RE.8
In Exercises 7–18, find the indicated area under the standard normal curve. If convenient, use technology to find the area.
To the left of z = -1.95
Problem 5.RS.1b
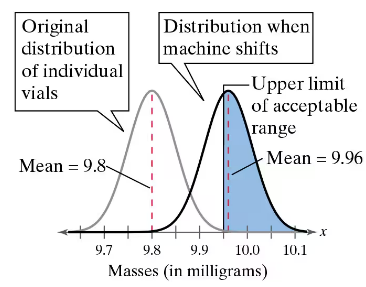
Assume the machine shifts and the distribution of the amount of the compound added now has a mean of 9.96 milligrams and a standard deviation of 0.05 milligram. You select one vial and determine how much of the compound was added.
b. You randomly select 15 vials. What is the probability that you select at least one vial that is within the acceptable range?
Problem 5.RS.2a
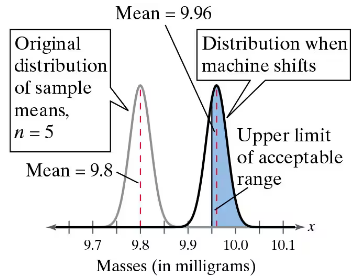
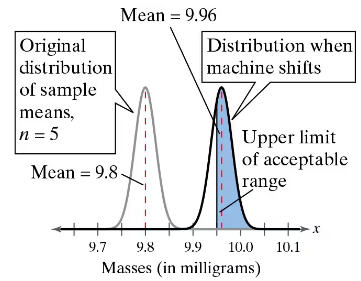
Assume the machine shifts and is filling the vials with a mean amount of 9.96 milligrams and a standard deviation of 0.05 milligram. You select five vials and find the mean amount of compound added.
a. What is the probability that you select a sample of five vials that has a mean that is within the acceptable range? (See figure.)
Problem 5.RS.2b
Assume the machine shifts and is filling the vials with a mean amount of 9.96 milligrams and a standard deviation of 0.05 milligram. You select five vials and find the mean amount of compound added.
b. You randomly select three samples of five vials. What is the probability that you select at least one sample of five vials that has a mean that is within the acceptable range?
Problem 5.RS.2c
Assume the machine shifts and is filling the vials with a mean amount of 9.96 milligrams and a standard deviation of 0.05 milligram. You select five vials and find the mean amount of compound added.
c. Which is more sensitive to a shift of parameters—an individual random selection or a randomly selected sample mean?
Problem 5.RS.1a
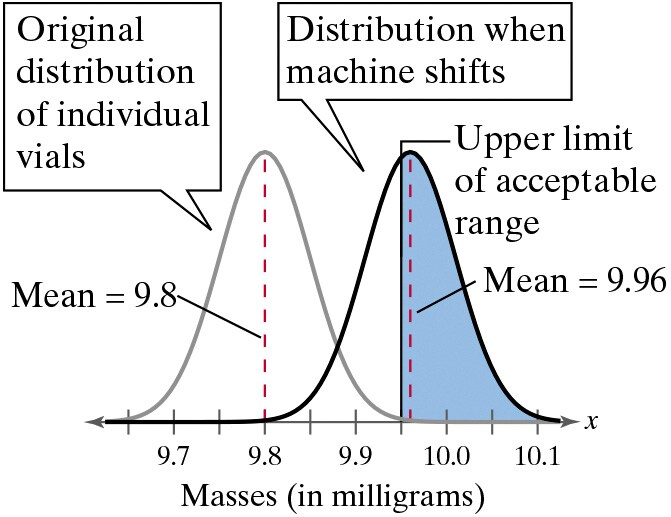
Assume the machine shifts and the distribution of the amount of the compound added now has a mean of 9.96 milligrams and a standard deviation of 0.05 milligram. You select one vial and determine how much of the compound was added.
a. What is the probability that you select a vial that is within the acceptable range (in other words, you do not detect that the machine has shifted)? (See figure.)
Problem 5.T.6
Use technology to find the standard deviation of the set of 36 sample means. How does it compare with the standard deviation of the ages found in Exercise 5? Does this agree with the result predicted by the Central Limit Theorem?
Problem 5.T.1c
During a recent period of one year, the mean percent increase in value on Wednesdays of the cryptocurrency Dogecoin was 7.46%, with a standard deviation of 53.47%. Random samples of size 50 are drawn from this population and the mean of each sample is determined. (Source: Crypto Indicators)
c. What is the probability that the mean percent increase for a given sample is between −10% and 30%?
Problem 5.T.3
In Exercises 2–4, the random variable x is normally distributed with mean mu= 18 and standard deviation sigma 7.6
Find the value of x that has 88.3% of the distribution’s area to its left.
Problem 5.T.5a
In Exercises 5 and 6, determine whether you can use a normal distribution to approximate the binomial distribution. If you can, use the normal distribution to approximate the indicated probabilities and sketch their graphs. If you cannot, explain why and use a binomial distribution to find the indicated probabilities.
A survey of U.S. undergraduates found that 37% of those attending in-state colleges would prefer to take a job in a different state after graduation. You randomly select 18 U.S. undergraduates attending in-state colleges. Find the probability that the number who would prefer to take a job in a different state after graduation is (a) exactly 7. Identify any unusual events. Explain.
Problem 5.T.1b
A certain stock's daily percent return on Fridays has a mean of 3.12% and a standard deviation of 41.25%. If random samples of 40 days are selected and the mean return for each sample is calculated, what is the probability that a sample mean is greater than 17%?
Problem 5.T.3b
In Exercises 5 and 6, determine whether you can use a normal distribution to approximate the binomial distribution. If you can, use the normal distribution to approximate the indicated probabilities and sketch their graphs. If you cannot, explain why and use a binomial distribution to find the indicated probabilities.
A survey of U.S. undergraduates found that 37% of those attending in-state colleges would prefer to take a job in a different state after graduation. You randomly select 18 U.S. undergraduates attending in-state colleges. Find the probability that the number who would prefer to take a job in a different state after graduation is (b) less than 5. Identify any unusual events. Explain.
Problem 5.T.8
The per capita disposable income for residents of a U.S. city in a recent year is normally distributed, with a mean of about $44,000 and a standard deviation of about $2450. Use this information in Exercises 7–10.
Out of 800 residents, about how many would you expect to have a disposable income of between $40,000 and $42,000?
Problem 5.T.2b
In Exercises 2–4, the random variable x is normally distributed with mean mu= 18 and standard deviation sigma 7.6
Find each probability.
b. P(0 < x < 5)
Problem 5.T.3c
In Exercises 5 and 6, determine whether you can use a normal distribution to approximate the binomial distribution. If you can, use the normal distribution to approximate the indicated probabilities and sketch their graphs. If you cannot, explain why and use a binomial distribution to find the indicated probabilities.
A survey of U.S. undergraduates found that 37% of those attending in-state colleges would prefer to take a job in a different state after graduation. You randomly select 18 U.S. undergraduates attending in-state colleges. Find the probability that the number who would prefer to take a job in a different state after graduation is (c) at least 10. Identify any unusual events. Explain.