Back
BackProblem 5.Q.11
In a survey of U.S. adults, 81% feel they have little or no control over data collected about them by companies. You randomly select 250 U.S. adults and ask them whether they feel they have control over data collected about them by companies. Use this information in Exercises 11 and 12. (Source: Pew Research Center)
Determine whether you can use a normal distribution to approximate the binomial distribution. If you can, find the mean and standard deviation. If you cannot, explain why.
Problem 5.Q.5
In a standardized IQ test, scores are normally distributed, with a mean score of 100 and a standardized deviation of 15. Use this information in Exercises 3–10. (Adapted from 123test)
What percent of the IQ scores are greater than 112?
Problem 5.Q.4b
The random variable x is normally distributed with the given parameters. Find each probability.
b. μ = 87, σ ≈ 19, P(x > 40.5)
Problem 5.Q.4c
The random variable x is normally distributed with the given parameters. Find each probability.
c. μ = 5.5, σ ≈ 0.08, P(5.36 < x < 5.64)
Problem 5.Q.4a
The random variable x is normally distributed with the given parameters. Find each probability.
a. μ = 9.2, σ ≈ 1.62, P(x < 5.97)
Problem 5.Q.2c
The random variable x is normally distributed with the given parameters. Find each probability.
c. μ = 5.5, σ ≈ 0.08, P(5.36 < x < 5.64)
Problem 5.R.51b
In Exercises 51 and 52, a population and sample size are given. (b) List all samples (with replacement) of the given size from the population and find the mean of each. (c) Find the mean and standard deviation of the sampling distribution of sample means and compare them with the mean and standard deviation of the population.
The goals scored in a season by the four starting defenders on a soccer team are 1, 2, 0, and 3. Use a sample size of 2.
Problem 5.R.38
In Exercises 37–42, use the Standard Normal Table or technology to find the z-score that corresponds to the cumulative area or percentile.
0.1
Problem 5.R.56c
In Exercises 55–60, find the indicated probabilities and interpret the results.
Refer to Exercise 34. A random sample of six days is selected. Find the probability that the mean surface concentration of carbonyl sulfide for the sample is (c) more than 11.1 picomoles per liter. Compare your answers with those in Exercise 34.
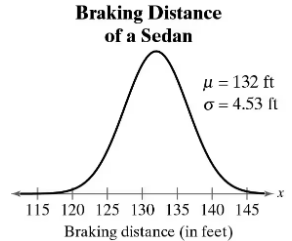
Problem 5.R.48
What braking distance represents the first quartile?
Problem 5.R.41
In Exercises 37–42, use the Standard Normal Table or technology to find the z-score that corresponds to the cumulative area or percentile.
P85
Problem 5.R.55c
In Exercises 55–60, find the indicated probabilities and interpret the results.
Refer to Exercise 33. A random sample of 2 years is selected. Find the probability that the mean amount of greenhouse gases for the sample is (c) greater than 5900 MMT CO2 eq. Compare your answers with those in Exercise 33.
Problem 5.R.53
In Exercises 53 and 54, find the mean and standard deviation of the indicated sampling distribution of sample means. Then sketch a graph of the sampling distribution.
The population densities in people per square mile in the 50 U.S. states have a mean of 199.6 and a standard deviation of 265.4. Random samples of size 35 are drawn from this population, and the mean of each sample is determined.
Problem 5.R.58a
In Exercises 55–60, find the indicated probabilities and interpret the results.
The mean MCAT total score in a recent year is 500.9. A random sample of 32 MCAT total scores is selected. What is the probability that the mean score for the sample is (a) less than 503? Assume sigma=10.6.
Problem 5.R.61
In Exercises 61 and 62, a binomial experiment is given. Determine whether you can use a normal distribution to approximate the binomial distribution. If you can, find the mean and standard deviation. If you cannot, explain why.
A survey of U.S. adults ages 33 to 40 earning more than $150,000 per year found that 94% are content with how their lives have turned out so far. You randomly select 20 U.S. adults ages 33 to 40 earning more than $150,000 and ask if they are content with their lives so far.
Problem 5.R.55b
In Exercises 55–60, find the indicated probabilities and interpret the results.
Refer to Exercise 33. A random sample of 2 years is selected. Find the probability that the mean amount of greenhouse gases for the sample is (b) between 6000 and 6500 MMT CO2 eq. Compare your answers with those in Exercise 33.
Problem 5.R.69c
In Exercises 69 and 70, determine whether you can use a normal distribution to approximate the binomial distribution. If you can, use the normal distribution to approximate the indicated probabilities and sketch their graphs. If you cannot, explain why and use a binomial distribution to find the indicated probabilities.
A survey of U.S. adults found that 72% used a mobile device to manage their bank account at least once in the previous month. You randomly select 70 U.S. adults and ask whether they used a mobile device to manage their bank account at least once in the previous month. Find the probability that the number who have done so is (c) greater than 60.
Problem 5.R.67
In Exercises 63–68, write the binomial probability in words. Then, use a continuity correction to convert the binomial probability to a normal distribution probability.
P(x < 60)
Problem 5.R.56a
In Exercises 55–60, find the indicated probabilities and interpret the results.
Refer to Exercise 34. A random sample of six days is selected. Find the probability that the mean surface concentration of carbonyl sulfide for the sample is (a) between 5.1 and 15.7 picomoles per liter. Compare your answers with those in Exercise 34.
Problem 5.R.57c
In Exercises 55–60, find the indicated probabilities and interpret the results.
The mean ACT composite score in a recent year is 20.7. A random sample of 36 ACT composite scores is selected. What is the probability that the mean score for the sample is (c) between 20 and 21.5? Assume σ=5.9.
Problem 5.R.59a
In Exercises 55–60, find the indicated probabilities and interpret the results.
The mean annual salary for Level 1 actuaries in the United States is about $72,000. A random sample of 45 Level 1 actuaries is selected. What is the probability that the mean annual salary of the sample is (a) less than $75,000? Assume sigma = $11,000.
Problem 5.R.55a
In Exercises 55–60, find the indicated probabilities and interpret the results.
Refer to Exercise 33. A random sample of 2 years is selected. Find the probability that the mean amount of greenhouse gases for the sample is (a) less than 5500 MMT CO2 eq. Compare your answers with those in Exercise 33.
Problem 5.R.64
In Exercises 63–68, write the binomial probability in words. Then, use a continuity correction to convert the binomial probability to a normal distribution probability.
P(x ≤ 36)
Problem 5.R.60a
In Exercises 55–60, find the indicated probabilities and interpret the results.
The mean annual salary for physical therapists in the United States is about $87,000. A random sample of 50 physical therapists is selected. What is the probability that the mean annual salary of the sample is (a) less than $84,000? Assume sigma = $10,500.
Problem 5.R.54
In Exercises 53 and 54, find the mean and standard deviation of the indicated sampling distribution of sample means. Then sketch a graph of the sampling distribution.
The test scores for the Law School Admission Test (LSAT) in a recent year are normally distributed, with a mean of 151.88 and a standard deviation of 9.95. Random samples of size 40 are drawn from this population, and the mean of each sample is determined.
Problem 5.R.51a
In Exercises 51 and 52, a population and sample size are given. (a) Find the mean and standard deviation of the population.
The goals scored in a season by the four starting defenders on a soccer team are 1, 2, 0, and 3. Use a sample size of 2.
Problem 5.R.13c
An auto parts seller finds that 1 in every 200 parts sold is defective. Use the geometric distribution to find the probability that (c) none of the first 20 parts sold are defective.
Problem 5.R.69b
In Exercises 69 and 70, determine whether you can use a normal distribution to approximate the binomial distribution. If you can, use the normal distribution to approximate the indicated probabilities and sketch their graphs. If you cannot, explain why and use a binomial distribution to find the indicated probabilities.
A survey of U.S. adults found that 72% used a mobile device to manage their bank account at least once in the previous month. You randomly select 70 U.S. adults and ask whether they used a mobile device to manage their bank account at least once in the previous month. Find the probability that the number who have done so is (b) exactly 50.
Problem 5.R.58b
In Exercises 55–60, find the indicated probabilities and interpret the results.
The mean MCAT total score in a recent year is 500.9. A random sample of 32 MCAT total scores is selected. What is the probability that the mean score for the sample is (b) more than 502? Assume sigma=10.6.
Problem 5.R.59b
In Exercises 55–60, find the indicated probabilities and interpret the results.
The mean annual salary for Level 1 actuaries in the United States is about $72,000. A random sample of 45 Level 1 actuaries is selected. What is the probability that the mean annual salary of the sample is (b) more than $68,000? Assume sigma = $11,000.