Back
BackProblem 5.2.20a
Red Blood Cell Count Use the normal distribution in Exercise 16.
a. What percent of the adult males have a red blood cell count less than 6 million cells per microliter?
Problem 5.2.12a
Finding Probabilities for Normal Distributions In Exercises 7–12, find the indicated probabilities. If convenient, use technology to find the probabilities.
Health Club Schedule The amounts of time per workout an athlete uses a stairclimber are normally distributed, with a mean of 20 minutes and a standard deviation of 5 minutes. Find the probability that a randomly selected athlete uses a stairclimber for (a) less than 17 minutes.
Problem 5.5.20a
Approximating Binomial Probabilities In Exercises 19–26, determine whether you can use a normal distribution to approximate the binomial distribution. If you can, use the normal distribution to approximate the indicated probabilities and sketch their graphs. If you cannot, explain why and use a binomial distribution to find the indicated probabilities. Identify any unusual events. Explain.
Social Media A survey of Americans found that 55% would be disappointed if Facebook disappeared. You randomly select 500 Americans and ask them whether they would be disappointed if Facebook disappeared. Find the probability that the number who say yes is (a) less than 250
Problem 5.2.19a
Pregnancy Length Use the normal distribution in Exercise 15.
a. What percent of the new mothers had a pregnancy length of less than 290 days?
Problem 5.2.9a
Finding Probabilities for Normal Distributions In Exercises 7–12, find the indicated probabilities. If convenient, use technology to find the probabilities.
MCAT Scores In a recent year, the MCAT total scores were normally distributed, with a mean of 500.9 and a standard deviation of 10.6. Find the probability that a randomly selected medical student who took the MCAT has a total score that is (a) less than 490. Identify any unusual events in parts (a)–(c). Explain your reasoning. (Source: Association of American Medical Colleges)
Problem 5.3.37a
Finding Specified Data Values In Exercises 31–38, answer the questions about the specified normal distribution.
Red Blood Cell Count The red blood cell counts (in millions of cells per microliter) for a population of adult males can be approximated by a normal distribution, with a mean of 5.4 million cells per microliter and a standard deviation of 0.4 million cells per microliter.
a. What is the minimum red blood cell count that can be in the top 25% of counts?
Problem 5.5.23a
Approximating Binomial Probabilities In Exercises 19–26, determine whether you can use a normal distribution to approximate the binomial distribution. If you can, use the normal distribution to approximate the indicated probabilities and sketch their graphs. If you cannot, explain why and use a binomial distribution to find the indicated probabilities. Identify any unusual events. Explain.
Athletes on Social Issues In a survey of college athletes, 84% said they are willing to speak up and be more active in social issues. You randomly select 25 college athletes. Find the probability that the number who are willing to speak up and be more active in social issues is (a) at least 24
Problem 5.1.60a
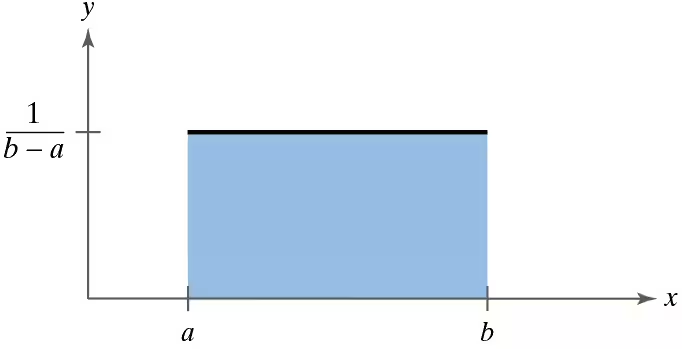
Uniform Distribution A uniform distribution is a continuous probability distribution for a random variable x between two values a and b (a<b), where (a ≤ x ≤ b) and all of the values of x are equally likely to occur. The graph of a uniform distribution is shown below.
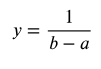
The probability density function of a uniform distribution is
on the interval from (x=a) to (x=b). For any value of x less than a or greater than b, y=0 . In Exercises 59 and 60, use this information.
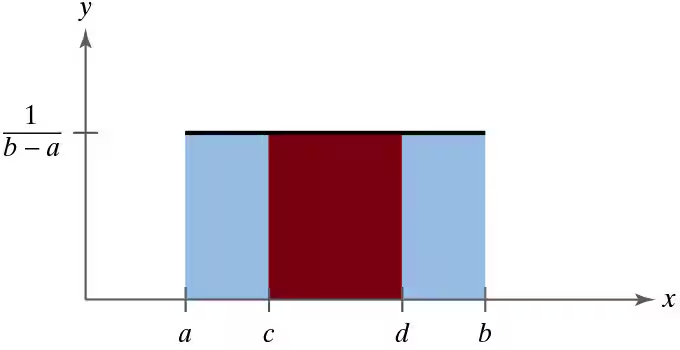
For two values c and d, where a ≤ c < d ≤ b, the probability that x lies between c and d is equal to the area under the curve between c and d, as shown below.
So, the area of the red region equals the probability that x lies between c and d. For a uniform distribution from (a=1) to (b=25) , find the probability that
a. x lies between 2 and 8.
Problem 5.1.37a
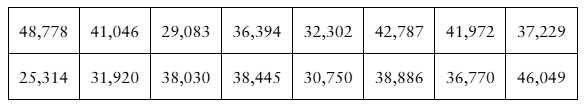
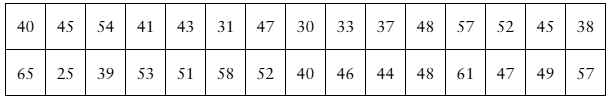
Manufacturer Claims You work for a consumer watchdog publication and are testing the advertising claims of a tire manufacturer. The manufacturer claims that the life spans of the tires are normally distributed, with a mean of 40,000 miles and a standard deviation of 4000 miles. You test 16 tires and record the life spans shown below.
a. Draw a frequency histogram to display these data. Use five classes. Do the life spans appear to be normally distributed? Explain.
Problem 5.5.26a
Approximating Binomial Probabilities In Exercises 19–26, determine whether you can use a normal distribution to approximate the binomial distribution. If you can, use the normal distribution to approximate the indicated probabilities and sketch their graphs. If you cannot, explain why and use a binomial distribution to find the indicated probabilities. Identify any unusual events. Explain.
Advancing Research In a survey of U.S. adults, 77% said are willing to share their personal health information to advance medical research. You randomly select 500 U.S. adults. Find the probability that the number who are willing to share their personal health information to advance medical research is (a) at most 400
Problem 5.1.38a
[APPLET] Milk Consumption You are performing a study about weekly per capita milk consumption. A previous study found weekly per capita milk consumption to be normally distributed, with a mean of 48.7 fluid ounces and a standard deviation of 8.6 fluid ounces. You randomly sample 30 people and record the weekly milk consumptions shown below.
a. Draw a frequency histogram to display these data. Use seven classes. Do the consumptions appear to be normally distributed? Explain.
Problem 5.4.38a
Ice Cream The weights of ice cream cartons are normally distributed with a mean weight of 10 ounces and a standard deviation of 0.5 ounce.
a. What is the probability that a randomly selected carton has a weight greater than 10.21 ounces?
Problem 5.5.26b
Approximating Binomial Probabilities In Exercises 19–26, determine whether you can use a normal distribution to approximate the binomial distribution. If you can, use the normal distribution to approximate the indicated probabilities and sketch their graphs. If you cannot, explain why and use a binomial distribution to find the indicated probabilities. Identify any unusual events. Explain.
Advancing Research In a survey of U.S. adults, 77% said are willing to share their personal health information to advance medical research. You randomly select 500 U.S. adults. Find the probability that the number who are willing to share their personal health information to advance medical research is (b) more than 360
Problem 5.3.42b
History Grades In a history class, the grades for various assessments are all positive numbers and have different distributions. Determine whether the grades for each assessment could be normally distributed. Explain your reasoning.
b. a final with a mean of 72, standard deviation of 9, and 90th percentile score of 93
Problem 5.3.33b
Finding Specified Data Values In Exercises 31–38, answer the questions about the specified normal distribution.
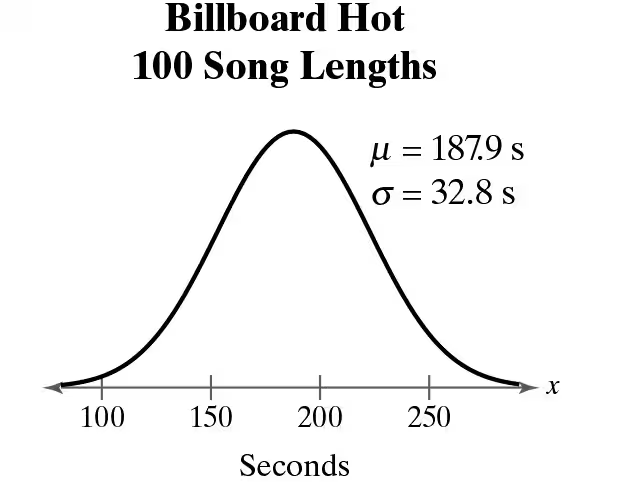
Billboard Hot 100 The length (in seconds) of the 100 most popular songs during the week of May 5, 2021, can be approximated by a normal distribution, as shown in the figure. (Source: Spotify)
b. What song length represents the 17th percentile?
Problem 5.5.20b
Approximating Binomial Probabilities In Exercises 19–26, determine whether you can use a normal distribution to approximate the binomial distribution. If you can, use the normal distribution to approximate the indicated probabilities and sketch their graphs. If you cannot, explain why and use a binomial distribution to find the indicated probabilities. Identify any unusual events. Explain.
Social Media A survey of Americans found that 55% would be disappointed if Facebook disappeared. You randomly select 500 Americans and ask them whether they would be disappointed if Facebook disappeared. Find the probability that the number who say yes is (b) at least 300
Problem 5.3.34b
Finding Specified Data Values In Exercises 31–38, answer the questions about the specified normal distribution.
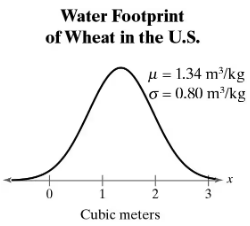
Water Footprint A water footprint is a measure of the appropriation of fresh water. The water footprint (in cubic meters) for a kilogram of wheat can be approximated by a normal distribution, as shown in the figure. (Source: Ecological Indicators)
b. What water footprint represents the 29th percentile?
Problem 5.2.17b
SAT Total Scores Use the normal distribution in Exercise 13.
b. Out of 1000 randomly selected SAT total scores, about how many would you expect to be greater than 1100?
Problem 5.3.32b
Finding Specified Data Values In Exercises 31–38, answer the questions about the specified normal distribution.
COVID-19 Response Surveyors asked respondents to rate ten key aspects of their government’s response to the COVID-19 pandemic, including preparedness, communication, and material aid. A pandemic response score that ranged from 0 to 100 was calculated. The mean score for U.S. respondents was 50.6 with a standard deviation of 29.0. (Source: PLOS One)
b. What score represents the 61st percentile?
Problem 5.2.12b
Finding Probabilities for Normal Distributions In Exercises 7–12, find the indicated probabilities. If convenient, use technology to find the probabilities.
Health Club Schedule The amounts of time per workout an athlete uses a stairclimber are normally distributed, with a mean of 20 minutes and a standard deviation of 5 minutes. Find the probability that a randomly selected athlete uses a stairclimber for (b) between 20 and 28 minutes.
Problem 5.5.23b
Approximating Binomial Probabilities In Exercises 19–26, determine whether you can use a normal distribution to approximate the binomial distribution. If you can, use the normal distribution to approximate the indicated probabilities and sketch their graphs. If you cannot, explain why and use a binomial distribution to find the indicated probabilities. Identify any unusual events. Explain.
Athletes on Social Issues In a survey of college athletes, 84% said they are willing to speak up and be more active in social issues. You randomly select 25 college athletes. Find the probability that the number who are willing to speak up and be more active in social issues is (b) less than 23
Problem 5.3.35b
Finding Specified Data Values In Exercises 31–38, answer the questions about the specified normal distribution.
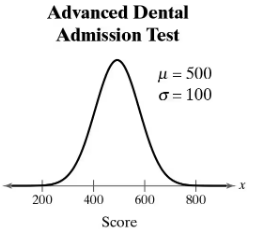
Advanced Dental Admission Test The Advanced Dental Admission Test (ADAT) is designed so that the scores fit a normal distribution, as shown in the figure. (Source: American Dental Association)
b. Between what two values does the middle 50% of the ADAT scores lie?
Problem 5.2.9b
Finding Probabilities for Normal Distributions In Exercises 7–12, find the indicated probabilities. If convenient, use technology to find the probabilities.
MCAT Scores In a recent year, the MCAT total scores were normally distributed, with a mean of 500.9 and a standard deviation of 10.6. Find the probability that a randomly selected medical student who took the MCAT has a total score that is (b) between 490 and 510. Identify any unusual events in parts (a)–(c). Explain your reasoning. (Source: Association of American Medical Colleges)
Problem 5.5.26c
Approximating Binomial Probabilities In Exercises 19–26, determine whether you can use a normal distribution to approximate the binomial distribution. If you can, use the normal distribution to approximate the indicated probabilities and sketch their graphs. If you cannot, explain why and use a binomial distribution to find the indicated probabilities. Identify any unusual events. Explain.
Advancing Research In a survey of U.S. adults, 77% said are willing to share their personal health information to advance medical research. You randomly select 500 U.S. adults. Find the probability that the number who are willing to share their personal health information to advance medical research is (c) between 380 and 390 inclusive.
Problem 5.5.23c
Approximating Binomial Probabilities In Exercises 19–26, determine whether you can use a normal distribution to approximate the binomial distribution. If you can, use the normal distribution to approximate the indicated probabilities and sketch their graphs. If you cannot, explain why and use a binomial distribution to find the indicated probabilities. Identify any unusual events. Explain.
Athletes on Social Issues In a survey of college athletes, 84% said they are willing to speak up and be more active in social issues. You randomly select 25 college athletes. Find the probability that the number who are willing to speak up and be more active in social issues is (c) between 18 and 22, inclusive.
Problem 5.2.9c
Finding Probabilities for Normal Distributions In Exercises 7–12, find the indicated probabilities. If convenient, use technology to find the probabilities.
MCAT Scores In a recent year, the MCAT total scores were normally distributed, with a mean of 500.9 and a standard deviation of 10.6. Find the probability that a randomly selected medical student who took the MCAT has a total score that is (c) more than 515. Identify any unusual events in parts (a)–(c). Explain your reasoning. (Source: Association of American Medical Colleges)
Problem 5.3.31c
Finding Specified Data Values In Exercises 31–38, answer the questions about the specified normal distribution.
Weights of Teenagers In a survey of 18-year old males, the mean weight was 166.7 pounds with a standard deviation of 49.3 pounds. (Adapted from National Center for Health Statistics)
c. What weight represents the first quartile?
Problem 5.5.27c
Daily Commute About 83% of U.S. employees drive their own vehicle to work. You randomly select a sample of U.S. employees. Find the probability that more than 100 of the employees drive their own vehicle to work. (Source: U.S. Bureau of Labor Statistics)
c. You select 150 U.S. employees.
Problem 5.5.20c
Approximating Binomial Probabilities In Exercises 19–26, determine whether you can use a normal distribution to approximate the binomial distribution. If you can, use the normal distribution to approximate the indicated probabilities and sketch their graphs. If you cannot, explain why and use a binomial distribution to find the indicated probabilities. Identify any unusual events. Explain.
Social Media A survey of Americans found that 55% would be disappointed if Facebook disappeared. You randomly select 500 Americans and ask them whether they would be disappointed if Facebook disappeared. Find the probability that the number who say yes is (c) between 240 and 280, inclusive.
Problem 5.5.28c
Employee Wellness A survey of employed U.S. adults found that only 35% believe their employer cares about their well-being. You randomly select a sample of U.S. employees. Find the probability that fewer than 100 believe their employer cares about their well-being. (Source: Gallup)
c. You select 400 U.S. employees.