Back
BackProblem 4.1.37
Finding an Expected Value In Exercises 37 and 38, find the expected value E(x) to the player for one play of the game. If x is the gain to a player in a game of chance, then E(x) is usually negative. This value gives the average amount per game the player can expect to lose.
In American roulette, the wheel has the 38 numbers, 00, 0, 1, 2, . . ., 34, 35, and 36, marked on equally spaced slots. If a player bets $1 on a number and wins, then the player keeps the dollar and receives an additional $35. Otherwise, the dollar is lost.
Problem 4.1.38
Finding an Expected Value In Exercises 37 and 38, find the expected value E(x) to the player for one play of the game. If x is the gain to a player in a game of chance, then E(x) is usually negative. This value gives the average amount per game the player can expect to lose.
A high school basketball team is selling $10 raffle tickets as part of a fund-raising program. The first prize is a trip to the Bahamas valued at $5460, and the second prize is a weekend ski package valued at $496. The remaining 18 prizes are $100 gas cards. The number of tickets sold is 3500.
Problem 4.1.43
Independent and Dependent Random Variables Two random variables x and y are independent when the value of x does not affect the value of y. When the variables are not independent, they are dependent. A new random variable can be formed by finding the sum or difference of random variables. If a random variable x has mean and a random variable y has mean , then the means of the sum and difference of the variables are given by . If random variables are independent, then the variance and standard deviation of the sum or difference of the random variables can be found. So, if a random variable x has variance and a random variable y has variance , then the variances of the sum and difference of the variables are given by In Exercises 43 and 44, the distribution of SAT mathematics scores for college-bound male seniors in 2020 has a mean of 531 and a standard deviation of 121. The distribution of SAT mathematics scores for college-bound female seniors in 2020 has a mean of 516 and a standard deviation of 112. One male and one female are randomly selected. Assume their scores are independent. (Adapted from College Board)
Find the mean and standard deviation of the sum of their scores.
Problem 4.1.41
Linear Transformation of a Random Variable In Exercises 41 and 42, use this information about linear transformations. For a random variable x, a new random variable y can be created by applying a linear transformation , where a and b are constants. If the random variable x has mean and standard deviation , then the mean, variance, and standard deviation of y are given by the formulas
The mean annual salary of employees at an office is originally $46,000. Each employee receives an annual bonus of $600 and a 3% raise (based on salary). What is the new mean annual salary (including the bonus and raise)?
Problem 4.1.40
Baseball There were 116 World Series from 1903 to 2020. Use the probability distribution in Exercise 30 to find the number of World Series that had 4, 5, 6, 7, and 8 games. Find the population mean, variance, and standard deviation of the data using the traditional definitions. Compare to your answers in Exercise 30.
Problem 4.1.19
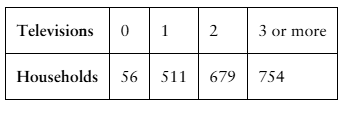
Constructing and Graphing Discrete Probability Distributions In Exercises 19 and 20, (a) construct a probability distribution, and (b) graph the probability distribution using a histogram and describe its shape.
Televisions The number of high-definition (HD) televisions per household in a small town
Problem 4.1.3
Is the expected value of the probability distribution of a random variable always one of the possible values of x? Explain.v
Problem 4.1.6
True or False? In Exercises 5–8, determine whether the statement is true or false. If it is false, rewrite it as a true statement.
For a random variable x, the word random indicates that the value of x is determined by chance.
Problem 4.1.14
Discrete Variables and Continuous Variables In Exercises 13–18, determine whether the random variable x is discrete or continuous. Explain.
Let x represent the length of time it takes to complete an exam.
Problem 4.1.16
Discrete Variables and Continuous Variables In Exercises 13–18, determine whether the random variable x is discrete or continuous. Explain.
Let x represent the populations of the 50 U.S. states.
Problem 4.1.17
Discrete Variables and Continuous Variables In Exercises 13–18, determine whether the random variable x is discrete or continuous. Explain.
Let x represent the fitted hat sizes of members of a softball team.
Problem 4.1.9
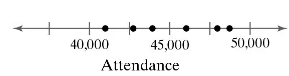
Graphical Analysis In Exercises 9–12, determine whether the graph on the number line represents a discrete random variable or a continuous random variable. Explain your reasoning.
The attendance at concerts for a rock group
Problem 4.1.11
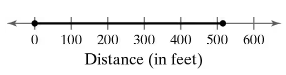
Graphical Analysis In Exercises 9–12, determine whether the graph on the number line represents a discrete random variable or a continuous random variable. Explain your reasoning.
The distance a baseball travels after being hit
Problem 4.1.21a
Finding Probabilities Use the probability distribution you made in Exercise 19 to find the probability of randomly selecting a household that has (a) one or two HD televisions
Problem 4.1.21b
Finding Probabilities Use the probability distribution you made in Exercise 19 to find the probability of randomly selecting a household that has (b) two or more HD televisions
Problem 4.1.21c
Finding Probabilities Use the probability distribution you made in Exercise 19 to find the probability of randomly selecting a household that has (c) from one to three HD televisions,
Problem 4.1.23
Unusual Events In Exercise 19, would it be unusual for a household to have no HD televisions? Explain your reasoning.
Problem 4.1.21d
Finding Probabilities Use the probability distribution you made in Exercise 19 to find the probability of randomly selecting a household that has (d) at most two HD televisions.
Problem 4.1.25
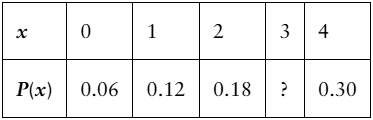
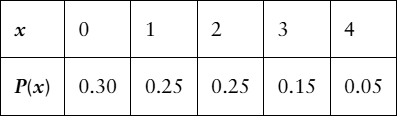
Determining a Missing Probability In Exercises 25 and 26, determine the missing probability for the probability distribution.
Problem 4.1.26
Determining a Missing Probability In Exercises 25 and 26, determine the missing probability for the probability distribution.
Problem 4.1.27
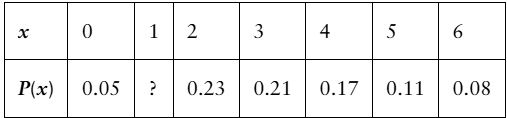
Identifying Probability Distributions In Exercises 27 and 28, determine whether the distribution is a probability distribution. If it is not a probability distribution, explain why.
Problem 4.1.7
"True or False? In Exercises 5–8, determine whether the statement is true or false. If it is false, rewrite it as a true statement.
The mean of the random variable of a probability distribution describes how the outcomes vary."
Problem 4.2.3
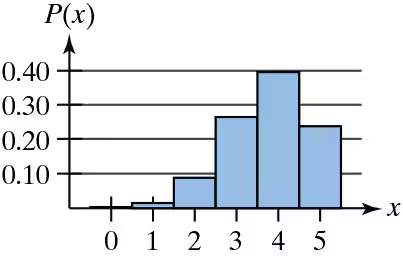
Graphical Analysis In Exercises 3–5, the histogram represents a binomial distribution with five trials. Match the histogram with the appropriate probability of success p. Explain your reasoning.
a. p = 0.25
b. p = 0.50
c. p = 0.75
Problem 4.2.5
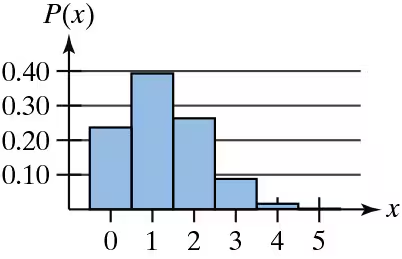
Graphical Analysis In Exercises 3–5, the histogram represents a binomial distribution with five trials. Match the histogram with the appropriate probability of success p. Explain your reasoning.
a. p = 0.25
b. p = 0.50
c. p = 0.75
Problem 4.2.41b
Manufacturing An assembly line produces 10,000 automobile parts. Twenty percent of the parts are defective. An inspector randomly selects 10 of the parts
b. Because the sample is only 0.1% of the population, treat the events as independent and use the binomial probability formula to approximate the probability that none of the selected parts are defective.
Problem 4.2.41a
Manufacturing An assembly line produces 10,000 automobile parts. Twenty percent of the parts are defective. An inspector randomly selects 10 of the parts
a. Use the Multiplication Rule (discussed in Section 3.2) to find the probability that none of the selected parts are defective. (Note that the events are dependent.)
Problem 4.2.37a
Unusual Events In Exercises 37 and 38, find the indicated probabilities. Then determine if the event is unusual. Explain your reasoning.
Rock-Paper-Scissors The probability of winning a game of rock-paper-scissors is 1/3. You play nine games of rock-paper-scissors. Find the probability that the number of games you win is (a) exactly five
Problem 4.2.27
Constructing and Graphing Binomial Distributions In Exercises 27–30, (a) construct a binomial distribution, (b) graph the binomial distribution using a histogram and describe its shape, and (c) identify any values of the random variable x that you would consider unusual. Explain your reasoning.
College Acceptance Pennsylvania State University accepts 49% of applicants. You randomly select seven Pennsylvania State University applicants. The random variable represents the number who are accepted. (Source: US News & World Report)
Problem 4.2.30
Constructing and Graphing Binomial Distributions In Exercises 27–30, (a) construct a binomial distribution, (b) graph the binomial distribution using a histogram and describe its shape, and (c) identify any values of the random variable x that you would consider unusual. Explain your reasoning.
Workplace Cleanliness Fifty-seven percent of employees judge their peers by the cleanliness of their workspaces. You randomly select 10 employees and ask them whether they judge their peers by the cleanliness of their workspaces. The random variable represents the number who judge their peers by the cleanliness of their workspaces. (Source: Adecco)
Problem 4.2.11
Mean, Variance, and Standard Deviation In Exercises 11–14, find the mean, variance, and standard deviation of the binomial distribution with the given values of n and p.
n = 50, p = 0.4