Back
BackProblem 4.2.39
Multinomial Experiments In Exercises 39 and 40, use the information below.
A multinomial experiment satisfies these conditions.
The experiment has a fixed number of trials n, where each trial is independent of the other trials.
Each trial has k possible mutually exclusive outcomes:
Each outcome has a fixed probability. So, . The sum of the probabilities for all outcomes is
The number of times occurs is , the number of times occurs is , the number of times occurs is , and so on.
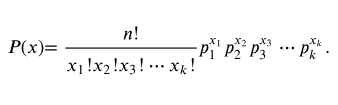
The discrete random variable x counts the number of times that each outcome occurs in n independent trials where . The probability that x will occur is
Genetics According to a theory in genetics, when tall and colorful plants are crossed with short and colorless plants, four types of plants will result: tall and colorful, tall and colorless, short and colorful, and short and colorless, with corresponding probabilities of , and . Ten plants are selected. Find the probability that 5 will be tall and colorful, 2 will be tall and colorless, 2 will be short and colorful, and 1 will be short and colorless.
Problem 4.1.26
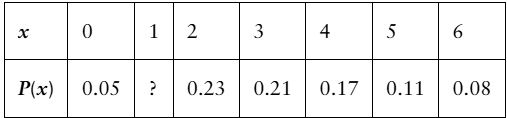
Determining a Missing Probability In Exercises 25 and 26, determine the missing probability for the probability distribution.
Problem 4.3.30
Geometric Distribution: Mean and Variance In Exercises 29 and 30, use the fact that the mean of a geometric distribution is μ = 1/p and the variance is
sigma^2 = q/p^2
Paycheck Errors A company assumes that 0.5% of the paychecks for a year were calculated incorrectly. The company has 200 employees and examines the payroll records from one month. (a) Find the mean, variance, and standard deviation. (b) How many employee payroll records would you expect to examine before finding one with an error?
Problem 4.1.23
Unusual Events In Exercise 19, would it be unusual for a household to have no HD televisions? Explain your reasoning.
Problem 4.2.15
Identifying and Understanding Binomial Experiments In Exercises 15–18, determine whether the experiment is a binomial experiment. If it is, identify a success; specify the values of n, p, and q; and list the possible values of the random variable x. If it is not a binomial experiment, explain why.
Video Games A survey found that 29% of gamers own a virtual reality (VR) device. Ten gamers are randomly selected. The random variable represents the number who own a VR device. (Source: Entertainment Software Association)
Problem 4.1.43
Independent and Dependent Random Variables Two random variables x and y are independent when the value of x does not affect the value of y. When the variables are not independent, they are dependent. A new random variable can be formed by finding the sum or difference of random variables. If a random variable x has mean and a random variable y has mean , then the means of the sum and difference of the variables are given by . If random variables are independent, then the variance and standard deviation of the sum or difference of the random variables can be found. So, if a random variable x has variance and a random variable y has variance , then the variances of the sum and difference of the variables are given by In Exercises 43 and 44, the distribution of SAT mathematics scores for college-bound male seniors in 2020 has a mean of 531 and a standard deviation of 121. The distribution of SAT mathematics scores for college-bound female seniors in 2020 has a mean of 516 and a standard deviation of 112. One male and one female are randomly selected. Assume their scores are independent. (Adapted from College Board)
Find the mean and standard deviation of the sum of their scores.
Problem 4.3.15
Using a Distribution to Find Probabilities In Exercises 11–26, find the indicated probabilities using the geometric distribution, the Poisson distribution, or the binomial distribution. Then determine whether the events are unusual. If convenient, use a table or technology to find the probabilities.
Pass Completions NFL player Aaron Rodgers completes a pass 65.1% of the time. Find the probability that (a) the first pass he completes is the second pass, (b) the first pass he completes is the first or second pass, and (c) he does not complete his first two passes. (Source: National Football League)
Problem 4.3.19
"Using a Distribution to Find Probabilities In Exercises 11–26, find the indicated probabilities using the geometric distribution, the Poisson distribution, or the binomial distribution. Then determine whether the events are unusual. If convenient, use a table or technology to find the probabilities.
Hurricanes The mean number of hurricanes to strike the U.S. mainland per year from 1851 through 2020 was about 1.8. Find the probability that the number of hurricanes striking the U.S. mainland in any given year from 1851 through 2020 is (a) exactly one, (b) at most one, and (c) more than one. (Source: National Oceanic & Atmospheric Administration)"
Problem 4.1.40
Baseball There were 116 World Series from 1903 to 2020. Use the probability distribution in Exercise 30 to find the number of World Series that had 4, 5, 6, 7, and 8 games. Find the population mean, variance, and standard deviation of the data using the traditional definitions. Compare to your answers in Exercise 30.
Problem 4.1.29
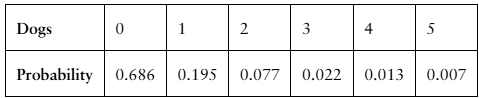
Finding the Mean, Variance, and Standard Deviation In Exercises 29–34, (a) find the mean, variance, and standard deviation of the probability distribution, and (b) interpret the results.
Dogs The number of dogs per household in a neighborhood
Problem 4.2.30
Constructing and Graphing Binomial Distributions In Exercises 27–30, (a) construct a binomial distribution, (b) graph the binomial distribution using a histogram and describe its shape, and (c) identify any values of the random variable x that you would consider unusual. Explain your reasoning.
Workplace Cleanliness Fifty-seven percent of employees judge their peers by the cleanliness of their workspaces. You randomly select 10 employees and ask them whether they judge their peers by the cleanliness of their workspaces. The random variable represents the number who judge their peers by the cleanliness of their workspaces. (Source: Adecco)
Problem 4.1.31
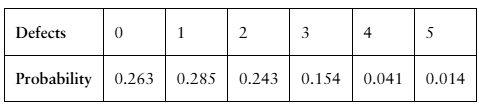
Finding the Mean, Variance, and Standard Deviation In Exercises 29–34, (a) find the mean, variance, and standard deviation of the probability distribution, and (b) interpret the results.
Machine Parts The number of defects per 1000 machine parts inspected
Problem 4.1.11
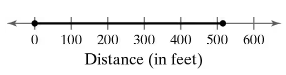
Graphical Analysis In Exercises 9–12, determine whether the graph on the number line represents a discrete random variable or a continuous random variable. Explain your reasoning.
The distance a baseball travels after being hit
Problem 4.2.33
Finding and Interpreting Mean, Variance, and Standard Deviation In Exercises 31–36, find the mean, variance, and standard deviation of the binomial distribution for the given random variable. Interpret the results and determine any unusual values.
Life on Other Planets Seventy-nine percent of U.S. adults believe that life on other planets is plausible. You randomly select eight U.S. adults and ask them whether they believe that life on other planets is plausible. The random variable represents the number who believe that life on other planets is plausible. (Source: Ipsos)
Problem 4.Q.2c
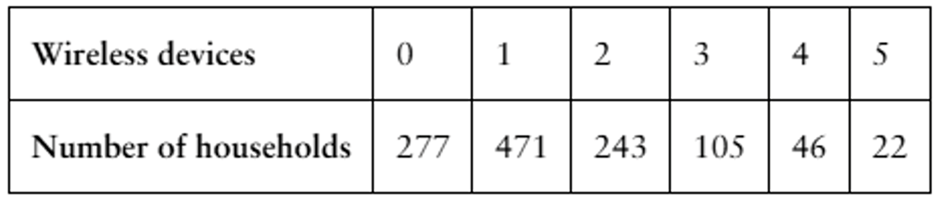
The table lists the number of wireless devices per household in a small town in the United States.
c. Find the mean, variance, and standard deviation of the probability distribution and interpret the results.
Problem 4.Q.5
An online magazine finds that the mean number of typographical errors per page is five. Find the probability that the number of typographical errors found on any given page is (a) exactly five, (b) less than five, and (c) exactly zero.
Problem 4.Q.3
In the past year, thirty-three percent of U.S. adults have put off medical treatment because of the cost. You randomly select nine U.S. adults. Find the probability that the number who have put off medical treatment because of the cost in the past year is (a) exactly three, (b) at most four, and (c) more than five. (Source: Gallup)
Problem 4.Q.4b
The five-year survival rate of people who undergo a liver transplant is 75%. The surgery is performed on six patients. (Source: Mayo Clinic)
b. Graph the binomial distribution using a histogram and describe its shape.
Problem 4.Q.4a
The five-year survival rate of people who undergo a liver transplant is 75%. The surgery is performed on six patients. (Source: Mayo Clinic)
a. Construct a binomial distribution.
Problem 4.Q.2a
The table lists the number of wireless devices per household in a small town in the United States.
a. Construct a probability distribution.
Problem 4.R.7
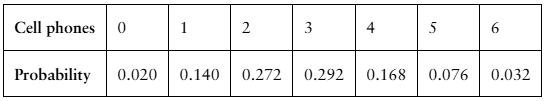
In Exercises 7 and 8, (a) find the mean, variance, and standard deviation of the probability distribution, and (b) interpret the results.
The number of cell phones per household in a small town
Problem 4.R.23b
In Exercises 21–26, find the indicated probabilities using the geometric distribution, the Poisson distribution, or the binomial distribution. Then determine whether the events are unusual. If convenient, use a table or technology to find the probabilities
Thirty-six percent of Americans think there is still a need for the practice of changing their clocks for Daylight Savings Time. You randomly select seven Americans. Find the probability that the number who say there is still a need for changing their clocks for Daylight Savings Time is (b) less than two
Problem 4.R.21b
In Exercises 21–26, find the indicated probabilities using the geometric distribution, the Poisson distribution, or the binomial distribution. Then determine whether the events are unusual. If convenient, use a table or technology to find the probabilities.
Fourteen percent of noninstitutionalized U.S. adults smoke cigarettes. After randomly selecting ten noninstitutionalized U.S. adults, you ask them whether they smoke cigarettes. Find the probability that the first adult who smokes cigarettes is (b) the fourth or fifth person selected.
Problem 4.R.21a
In Exercises 21–26, find the indicated probabilities using the geometric distribution, the Poisson distribution, or the binomial distribution. Then determine whether the events are unusual. If convenient, use a table or technology to find the probabilities.
Fourteen percent of noninstitutionalized U.S. adults smoke cigarettes. After randomly selecting ten noninstitutionalized U.S. adults, you ask them whether they smoke cigarettes. Find the probability that the first adult who smokes cigarettes is (a) the third person selected.
Problem 4.R.17
In Exercises 17 and 18, (a) construct a binomial distribution, (b) graph the binomial distribution using a histogram and describe its shape, and (c) identify any values of the random variable x that you would consider unusual. Explain your reasoning.
Seventy-two percent of U.S adults have read a book in any format in the past year. You randomly select five U.S adults and ask them whether they have read a book in any format in the past year. The random variable represents the number of adults who have read a book in any format in the past year. (Source: Pew Research)
Problem 4.R.19
In Exercises 19 and 20, find the mean, variance, and standard deviation of the binomial distribution for the given random variable. Interpret the results and determine any unusual values.
About 13% of U.S. drivers are uninsured. You randomly select eight U.S. drivers and ask them whether they are uninsured. The random variable represents the number who are uninsured. (Source: Insurance Research Council)
Problem 4.R.23c
In Exercises 21–26, find the indicated probabilities using the geometric distribution, the Poisson distribution, or the binomial distribution. Then determine whether the events are unusual. If convenient, use a table or technology to find the probabilities
Thirty-six percent of Americans think there is still a need for the practice of changing their clocks for Daylight Savings Time. You randomly select seven Americans. Find the probability that the number who say there is still a need for changing their clocks for Daylight Savings Time is (c) at least six.
Problem 4.R.23a
In Exercises 21–26, find the indicated probabilities using the geometric distribution, the Poisson distribution, or the binomial distribution. Then determine whether the events are unusual. If convenient, use a table or technology to find the probabilities
Thirty-six percent of Americans think there is still a need for the practice of changing their clocks for Daylight Savings Time. You randomly select seven Americans. Find the probability that the number who say there is still a need for changing their clocks for Daylight Savings Time is (a) exactly four
Problem 4.R.4
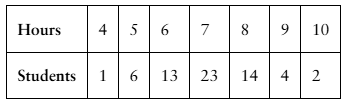
In Exercises 3 and 4, (a) construct a probability distribution, and (b) graph the probability distribution using a histogram and describe its shape.
The number of hours students in a college class slept the previous night
Problem 4.R.9
In Exercises 9 and 10, find the expected net gain to the player for one play of the game.
It costs $25 to bet on a horse race. The horse has a 1/8 chance of winning and a 1/4 chance of placing second or third. You win $125 if the horse wins and receive your money back if the horse places second or third.