Here are the essential concepts you must grasp in order to answer the question correctly.
Discrete Probability Distribution
A discrete probability distribution describes the likelihood of each possible outcome in a discrete sample space. In this context, it represents the number of high-definition televisions per household, where each outcome (0, 1, 2, or 3 or more televisions) has a corresponding probability calculated by dividing the number of households with that outcome by the total number of households.
Recommended video:
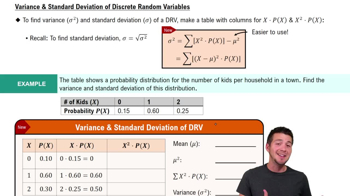
Variance & Standard Deviation of Discrete Random Variables
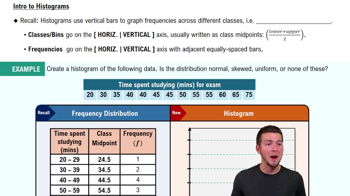
Histogram
A histogram is a graphical representation of the distribution of numerical data, where the data is divided into bins or intervals. In this case, the histogram will display the frequency of households for each category of televisions, allowing for a visual interpretation of the probability distribution and helping to identify patterns or trends in the data.
Recommended video:
Shape of the Distribution
The shape of a probability distribution provides insights into the data's characteristics, such as symmetry, skewness, and modality. For the given data on televisions per household, analyzing the histogram's shape will help determine whether the distribution is uniform, normal, skewed, or has multiple peaks, which can inform conclusions about household television ownership in the small town.
Recommended video:
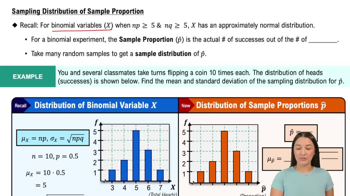
Sampling Distribution of Sample Proportion