Back
BackProblem 4.Q.2a
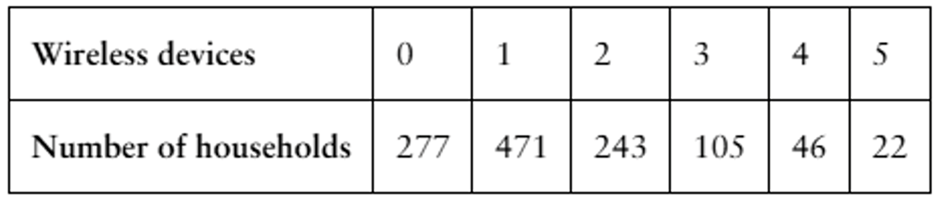
The table lists the number of wireless devices per household in a small town in the United States.
a. Construct a probability distribution.
Problem 4.Q.2c
The table lists the number of wireless devices per household in a small town in the United States.
c. Find the mean, variance, and standard deviation of the probability distribution and interpret the results.
Problem 4.Q.5
An online magazine finds that the mean number of typographical errors per page is five. Find the probability that the number of typographical errors found on any given page is (a) exactly five, (b) less than five, and (c) exactly zero.
Problem 4.R.4
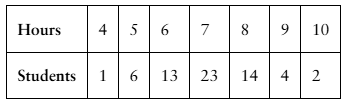
In Exercises 3 and 4, (a) construct a probability distribution, and (b) graph the probability distribution using a histogram and describe its shape.
The number of hours students in a college class slept the previous night
Problem 4.R.7
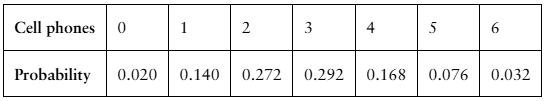
In Exercises 7 and 8, (a) find the mean, variance, and standard deviation of the probability distribution, and (b) interpret the results.
The number of cell phones per household in a small town
Problem 4.R.9
In Exercises 9 and 10, find the expected net gain to the player for one play of the game.
It costs $25 to bet on a horse race. The horse has a 1/8 chance of winning and a 1/4 chance of placing second or third. You win $125 if the horse wins and receive your money back if the horse places second or third.
Problem 4.R.23b
In Exercises 21–26, find the indicated probabilities using the geometric distribution, the Poisson distribution, or the binomial distribution. Then determine whether the events are unusual. If convenient, use a table or technology to find the probabilities
Thirty-six percent of Americans think there is still a need for the practice of changing their clocks for Daylight Savings Time. You randomly select seven Americans. Find the probability that the number who say there is still a need for changing their clocks for Daylight Savings Time is (b) less than two
Problem 4.T.3a
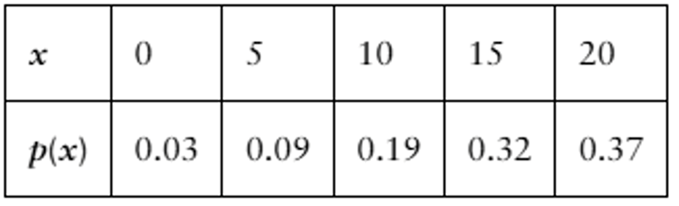
Determine whether the distribution is a probability distribution. If it is not a probability distribution, explain why.
Problem 4.T.5a
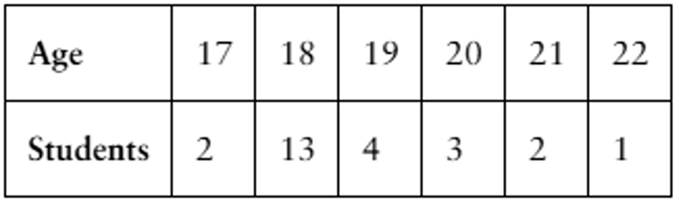
The table shows the ages of students in a freshman orientation course.
a. Construct a probability distribution.
Problem 4.T.5b
The table shows the ages of students in a freshman orientation course.
b. Graph the probability distribution using a histogram and describe its shape.
Problem 4.Real.1b
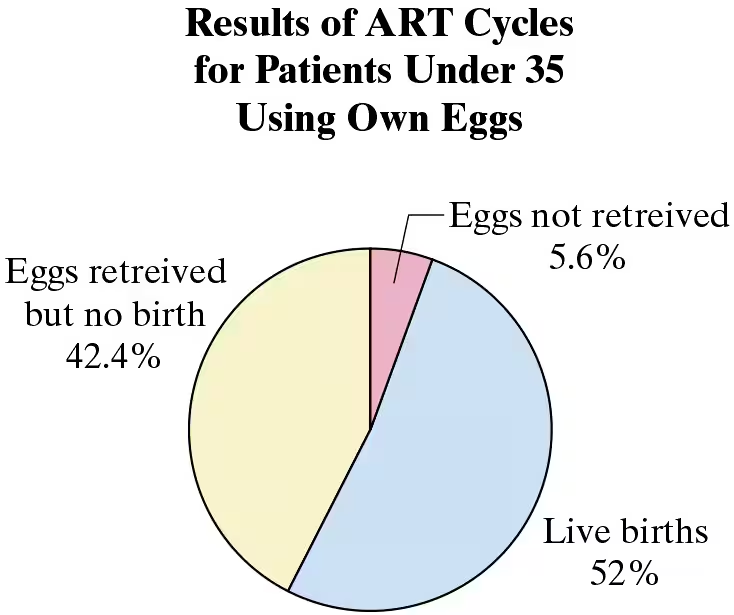
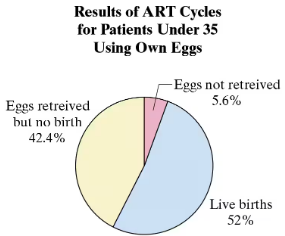
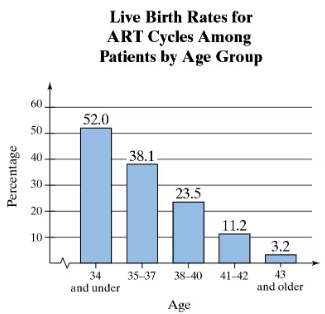
The Centers for Disease Control and Prevention (CDC) is required by law to publish a report on assisted reproductive technology (ART). ART includes all fertility treatments in which both the egg and the sperm are used. These procedures generally involve removing eggs from a patient’s ovaries, combining them with sperm in the laboratory, and returning them to the patient’s body or giving them to another patient.
You are helping to prepare a CDC report on young ART patients and select at random 6 ART cycles of patients under 35 years of age for a special review. None of the cycles resulted in a live birth. Your manager feels it is impossible to select at random 10 ART cycles that do not result in a live birth. Use the pie chart at the right and your knowledge of statistics to determine whether your manager is correct.
b. What probability distribution do you think best describes the situation? Do you think the distribution of the number of live births is discrete or continuous? Explain your reasoning.
Problem 4.RS.1a
The Centers for Disease Control and Prevention (CDC) is required by law to publish a report on assisted reproductive technology (ART). ART includes all fertility treatments in which both the egg and the sperm are used. These procedures generally involve removing eggs from a patient’s ovaries, combining them with sperm in the laboratory, and returning them to the patient’s body or giving them to another patient.
You are helping to prepare a CDC report on young ART patients and select at random 6 ART cycles of patients under 35 years of age for a special review. None of the cycles resulted in a live birth. Your manager feels it is impossible to select at random 10 ART cycles that do not result in a live birth. Use the pie chart at the right and your knowledge of statistics to determine whether your manager is correct.
a. How would you determine whether your manager is correct, that it is impossible to select at random six ART cycles that do not result in a live birth?
Problem 4.T.5
In Exercises 1–7, consider a grocery store that can process a total of four customers at its checkout counters each minute.
The mean number of customers who arrive at the checkout counters each minute is 4. Create a Poisson distribution with mu = 4 for x = 0 to 20. Compare your results with the histogram shown at the upper right.
Problem 4.T.7c
In Exercises 1–7, consider a grocery store that can process a total of four customers at its checkout counters each minute.
The mean number of arrivals per minute is four. Find the probability that
c. one customer is waiting in line after one minute and no customers are waiting in line after the second minute..
Problem 4.T.6c
In Exercises 1–7, consider a grocery store that can process a total of four customers at its checkout counters each minute.
The mean number of arrivals per minute is four. Find the probability that
c. more than four customers will arrive during each of the first four minutes.
Problem 4.T.1b
In Exercises 1–3, find the indicated probabilities using the geometric distribution, the Poisson distribution, or the binomial distribution. Then determine whether the events are unusual. If convenient, use a table or technology to find the probabilities.
One out of every 42 tax returns for incomes over $1 million requires an audit. An auditor is examining tax returns for over $1 million. Find the probability that (b) the first return requiring an audit is the first or second return the tax auditor examines,
Problem 4.T.1c
In Exercises 1–3, find the indicated probabilities using the geometric distribution, the Poisson distribution, or the binomial distribution. Then determine whether the events are unusual. If convenient, use a table or technology to find the probabilities.
One out of every 42 tax returns for incomes over $1 million requires an audit. An auditor is examining tax returns for over $1 million. Find the probability that (c) none of the first five returns the tax auditor examines require an audit.
Problem 4.RE.12
In Exercises 11 and 12, determine whether the experiment is a binomial experiment. If it is, identify a success; specify the values of n, p, and q; and list the possible values of the random variable x. If it is not a binomial experiment, explain why.
A fair coin is tossed repeatedly until 15 heads are obtained. The random variable x counts the number of tosses.
Problem 4.RE.13a
In Exercises 13–16, find the indicated binomial probabilities. If convenient, use technology or Table 2 in Appendix B.
Fifty-three percent of U.S. adults support attempting to land an astronaut on Mars. You randomly select eight U.S. adults. Find the probability that the number who support attempting to land an astronaut on Mars is (a) exactly three
Problem 4.RE.13b
In Exercises 13–16, find the indicated binomial probabilities. If convenient, use technology or Table 2 in Appendix B.
Fifty-three percent of U.S. adults support attempting to land an astronaut on Mars. You randomly select eight U.S. adults. Find the probability that the number who support attempting to land an astronaut on Mars is (b) at least three
Problem 4.RE.13c
In Exercises 13–16, find the indicated binomial probabilities. If convenient, use technology or Table 2 in Appendix B.
Fifty-three percent of U.S. adults support attempting to land an astronaut on Mars. You randomly select eight U.S. adults. Find the probability that the number who support attempting to land an astronaut on Mars is (c) more than three.
Problem 4.RE.15a
In Exercises 13–16, find the indicated binomial probabilities. If convenient, use technology or Table 2 in Appendix B.
Seventy-two percent of U.S. civilian employees have access to medical care benefits. You randomly select nine civilian employees. Find the probability that the number who have access to medical care benefits is (a) exactly six
Problem 4.RE.15b
In Exercises 13–16, find the indicated binomial probabilities. If convenient, use technology or Table 2 in Appendix B.
Seventy-two percent of U.S. civilian employees have access to medical care benefits. You randomly select nine civilian employees. Find the probability that the number who have access to medical care benefits is (b) at least six
Problem 4.RE.15c
In Exercises 13–16, find the indicated binomial probabilities. If convenient, use technology or Table 2 in Appendix B.
Seventy-two percent of U.S. civilian employees have access to medical care benefits. You randomly select nine civilian employees. Find the probability that the number who have access to medical care benefits is (c) more than six.
Problem 4.T.6a
In Exercises 1–7, consider a grocery store that can process a total of four customers at its checkout counters each minute.
The mean number of arrivals per minute is four. Find the probability that
a. three, four, or five customers will arrive during the third minute.
Problem 4.T.6b
In Exercises 1–7, consider a grocery store that can process a total of four customers at its checkout counters each minute.
The mean number of arrivals per minute is four. Find the probability that
b. more than four customers will arrive during the first minute.
Problem 4.T.2b
In Exercises 1–7, consider a grocery store that can process a total of four customers at its checkout counters each minute.
Minitab was used to generate 20 random numbers with a Poisson distribution for . Let the random number represent the number of arrivals at the checkout counter each minute for 20 minutes. 3 3 3 3 5 5 6 7 3 6 3 5 6 3 4 6 2 2 4 1During each of the first four minutes, only three customers arrived. These customers could all be processed, so there were no customers waiting after four minutes.
b. Create a table that shows the number of customers waiting at the end of 1 through 20 minutes.
Problem 4.T.4
In Exercises 1–7, consider a grocery store that can process a total of four customers at its checkout counters each minute.
The mean increases to five arrivals per minute, but the store can still process only four per minute. Generate a list of 20 random numbers with a Poisson distribution for mu = 5 . Then create a table that shows the number of customers waiting at the end of 20 minutes.
Problem 4.1.29
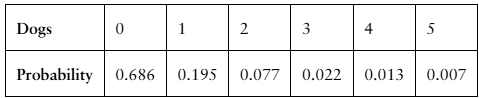
Finding the Mean, Variance, and Standard Deviation In Exercises 29–34, (a) find the mean, variance, and standard deviation of the probability distribution, and (b) interpret the results.
Dogs The number of dogs per household in a neighborhood
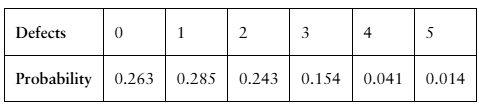
Problem 4.1.31
Finding the Mean, Variance, and Standard Deviation In Exercises 29–34, (a) find the mean, variance, and standard deviation of the probability distribution, and (b) interpret the results.
Machine Parts The number of defects per 1000 machine parts inspected