39. You are given that P(A) = 0.15 and P(B) = 0.40. Do you have enough information to find P(A or B)? Explain.
Table of contents
- 1. Intro to Stats and Collecting Data1h 14m
- 2. Describing Data with Tables and Graphs1h 56m
- 3. Describing Data Numerically2h 5m
- 4. Probability2h 16m
- 5. Binomial Distribution & Discrete Random Variables3h 6m
- 6. Normal Distribution and Continuous Random Variables2h 11m
- 7. Sampling Distributions & Confidence Intervals: Mean3h 23m
- Sampling Distribution of the Sample Mean and Central Limit Theorem19m
- Distribution of Sample Mean - Excel23m
- Introduction to Confidence Intervals15m
- Confidence Intervals for Population Mean1h 18m
- Determining the Minimum Sample Size Required12m
- Finding Probabilities and T Critical Values - Excel28m
- Confidence Intervals for Population Means - Excel25m
- 8. Sampling Distributions & Confidence Intervals: Proportion2h 10m
- 9. Hypothesis Testing for One Sample5h 8m
- Steps in Hypothesis Testing1h 6m
- Performing Hypothesis Tests: Means1h 4m
- Hypothesis Testing: Means - Excel42m
- Performing Hypothesis Tests: Proportions37m
- Hypothesis Testing: Proportions - Excel27m
- Performing Hypothesis Tests: Variance12m
- Critical Values and Rejection Regions28m
- Link Between Confidence Intervals and Hypothesis Testing12m
- Type I & Type II Errors16m
- 10. Hypothesis Testing for Two Samples5h 37m
- Two Proportions1h 13m
- Two Proportions Hypothesis Test - Excel28m
- Two Means - Unknown, Unequal Variance1h 3m
- Two Means - Unknown Variances Hypothesis Test - Excel12m
- Two Means - Unknown, Equal Variance15m
- Two Means - Unknown, Equal Variances Hypothesis Test - Excel9m
- Two Means - Known Variance12m
- Two Means - Sigma Known Hypothesis Test - Excel21m
- Two Means - Matched Pairs (Dependent Samples)42m
- Matched Pairs Hypothesis Test - Excel12m
- Two Variances and F Distribution29m
- Two Variances - Graphing Calculator16m
- 11. Correlation1h 24m
- 12. Regression3h 33m
- Linear Regression & Least Squares Method26m
- Residuals12m
- Coefficient of Determination12m
- Regression Line Equation and Coefficient of Determination - Excel8m
- Finding Residuals and Creating Residual Plots - Excel11m
- Inferences for Slope31m
- Enabling Data Analysis Toolpak1m
- Regression Readout of the Data Analysis Toolpak - Excel21m
- Prediction Intervals13m
- Prediction Intervals - Excel19m
- Multiple Regression - Excel29m
- Quadratic Regression15m
- Quadratic Regression - Excel10m
- 13. Chi-Square Tests & Goodness of Fit2h 21m
- 14. ANOVA2h 28m
4. Probability
Addition Rule
Problem 3.3.22b
Textbook Question
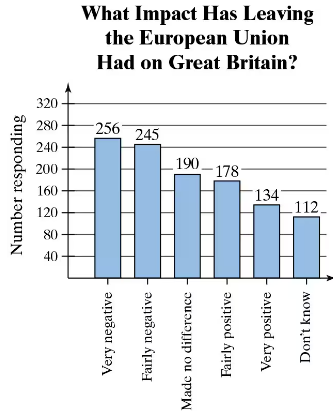
22. Brexit A survey asked 1115 British adults how Britain's decision to leave the European Union has impacted the country. The results are shown in the Pareto chart. Find the
probability of each event. (Adapted from Ipsos)
b. Randomly selecting a British adult who feels that the move has had a very negative impact on Great Britain

 Verified step by step guidance
1
Step 1: Identify the total number of respondents in the survey. According to the problem, the total number of British adults surveyed is 1115.
Step 2: Locate the number of respondents who feel that the move has had a 'very negative' impact. From the Pareto chart, this value is 256.
Step 3: Recall the formula for probability: \( P(A) = \frac{\text{Number of favorable outcomes}}{\text{Total number of outcomes}} \). Here, the favorable outcome is the number of respondents who feel the impact is 'very negative', and the total number of outcomes is the total number of respondents.
Step 4: Substitute the values into the formula: \( P(\text{Very Negative}) = \frac{256}{1115} \).
Step 5: Simplify the fraction if necessary to express the probability in its simplest form or as a decimal.
 Verified video answer for a similar problem:
This video solution was recommended by our tutors as helpful for the problem above
Video duration:
2mPlay a video:
0 Comments
Key Concepts
Here are the essential concepts you must grasp in order to answer the question correctly.
Probability
Probability is a measure of the likelihood that a particular event will occur, expressed as a number between 0 and 1. In this context, it refers to the chance of randomly selecting a British adult who perceives the impact of Brexit as 'very negative.' This can be calculated by dividing the number of respondents who selected 'very negative' by the total number of respondents.
Recommended video:

Introduction to Probability
Pareto Chart
A Pareto chart is a type of bar graph that represents the frequency or impact of problems in a descending order. It helps to visualize the most significant factors in a dataset. In this case, the chart displays the responses of British adults regarding the impact of Brexit, allowing for easy identification of the most common perceptions.
Recommended video:

Creating Bar Graphs and Pareto Charts
Survey Sampling
Survey sampling involves selecting a subset of individuals from a larger population to gather insights about that population. In this scenario, 1,115 British adults were surveyed to understand their views on Brexit. The sample size is crucial for ensuring that the results are representative and can be generalized to the broader population.
Recommended video:

Sampling Distribution of Sample Proportion

 5:14m
5:14mWatch next
Master Probability of Mutually Exclusive Events with a bite sized video explanation from Patrick
Start learningRelated Videos
Related Practice
Textbook Question
