Here are the essential concepts you must grasp in order to answer the question correctly.
Probability
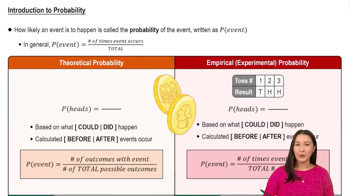
Probability is a measure of the likelihood that a particular event will occur, expressed as a number between 0 and 1. In this context, it involves calculating the chance of randomly selecting a person from a sample who falls into specific categories, such as 'unsure' or 'moderate' political viewpoints. Understanding how to compute probabilities based on survey data is essential for answering the question.
Recommended video:
Introduction to Probability
Pareto Chart
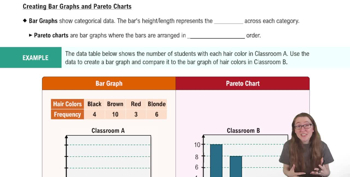
A Pareto chart is a type of bar graph that represents the frequency or impact of problems in a descending order, highlighting the most significant factors. In this case, the chart displays the political viewpoints of the surveyed individuals, allowing for a visual assessment of how many respondents identify as 'unsure' or 'moderate.' Familiarity with interpreting Pareto charts is crucial for extracting relevant data for probability calculations.
Recommended video:
Creating Bar Graphs and Pareto Charts
Sample Space
The sample space is the set of all possible outcomes in a probability experiment. For this question, it refers to the total number of respondents in the survey, which is 1500. Understanding the sample space is vital for calculating the probability of selecting individuals with specific characteristics, as it provides the denominator for probability calculations.
Recommended video:
Sampling Distribution of Sample Proportion